


Weekly market update
Investment markets and key developments
After a shaky few days in equity markets late last week and early into this week, global shares still managed to rise despite mixed economic data, “stagflation” concerns in the US economy, more announcements on higher tariff rates for India and semiconductors and elevated bond yields.
10 min read

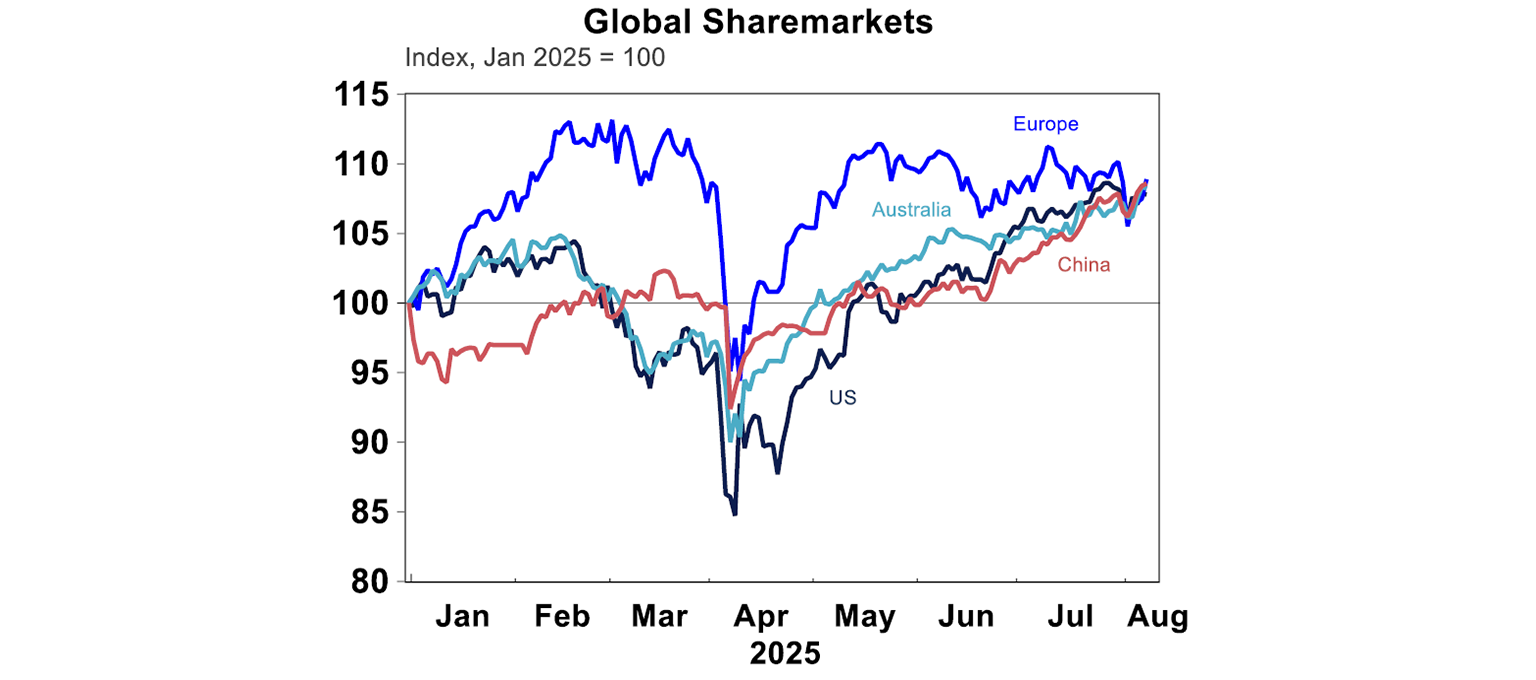
After a shaky few days in equity markets late last week and early into this week, global shares still managed to rise despite mixed economic data, “stagflation” concerns in the US economy, more announcements on higher tariff rates for India and semiconductors and elevated bond yields. To counter these negatives, US reporting season has been solid and there are hopes that Russia and Ukraine will reach a deal over the war in Ukraine soon. US equities are up by 2.4%, Eurozone +3.5%, Japan +2.5%, China +1.2% and Australia +1.7%. Eurozone shares were outperforming this year, but US markets have rallied hard since the April lows. Chinese shares have also performed well this year (see the chart below).
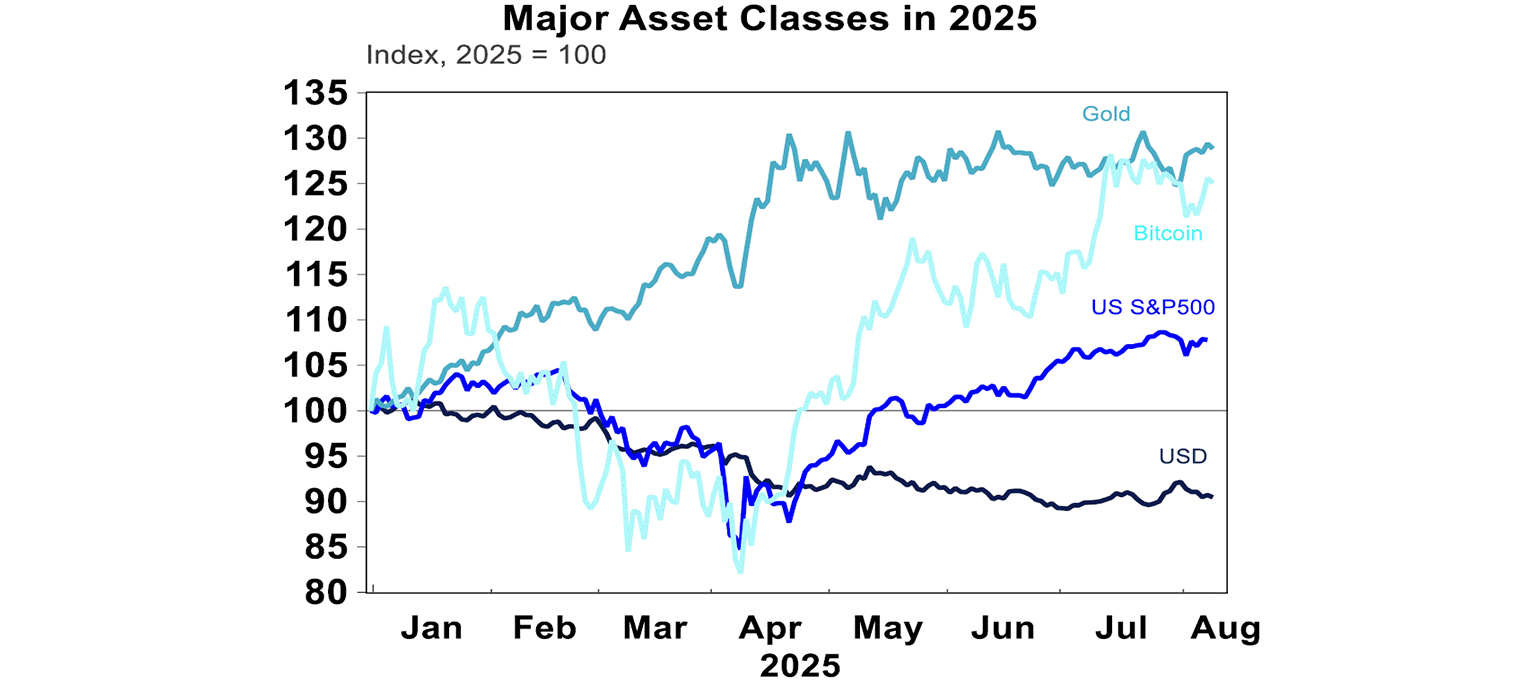
Bitcoin and gold continue to outperform US equities in 2025. The $US has stopped deteriorating, but is still down by ~10% since the beginning of the year.
Despite the good gains made in sharemarkets this year, there remains a high risk of a modest global equities correction (driven by the US):
Investors fears around trade have settled as tariff rates on the US’s largest trading partners have more or less been signed. However, as we saw this week, secondary tariffs (like the additional 25% on India for buying Russian energy) are still possible, sector tariffs (like this week’s threat of 100% tariffs on chips and semiconductors exempting companies who are investing directly into the US like Apple) are probable (large pharmaceutical tariff rates are still likely) and the US/China trade “truce” hasn’t actually been finalised.
Sharemarket valuations are stretched
August and September are not favourable seasonal months for the US S&P500
The economic data is at risk of deteriorating from the impacts of trade uncertainty and higher prices
So the next few months are likely to be messy for sharemarkets and the US is likely to underperform. But on a 6-12 month outlook, we think sharemarkets will be higher as Trump pivots towards more market friendly policies, the economic data stabilises and the Fed cuts rates again.
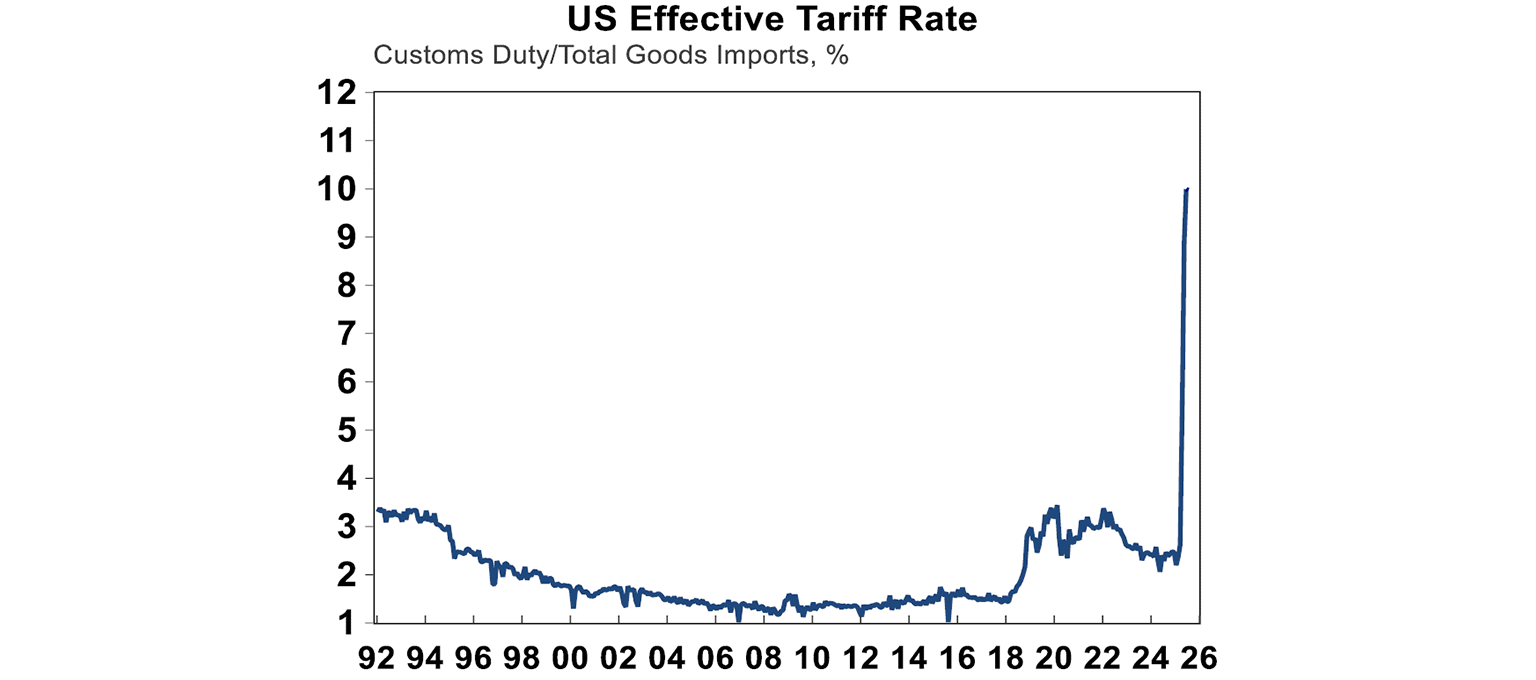
The ”effective” tariff rate (based on customs duties) as at July is still tracking around 10% from just over 2% in January, but we think it will end up settling at around 15%. So, the full impact of tariffs has not been fully felt yet.
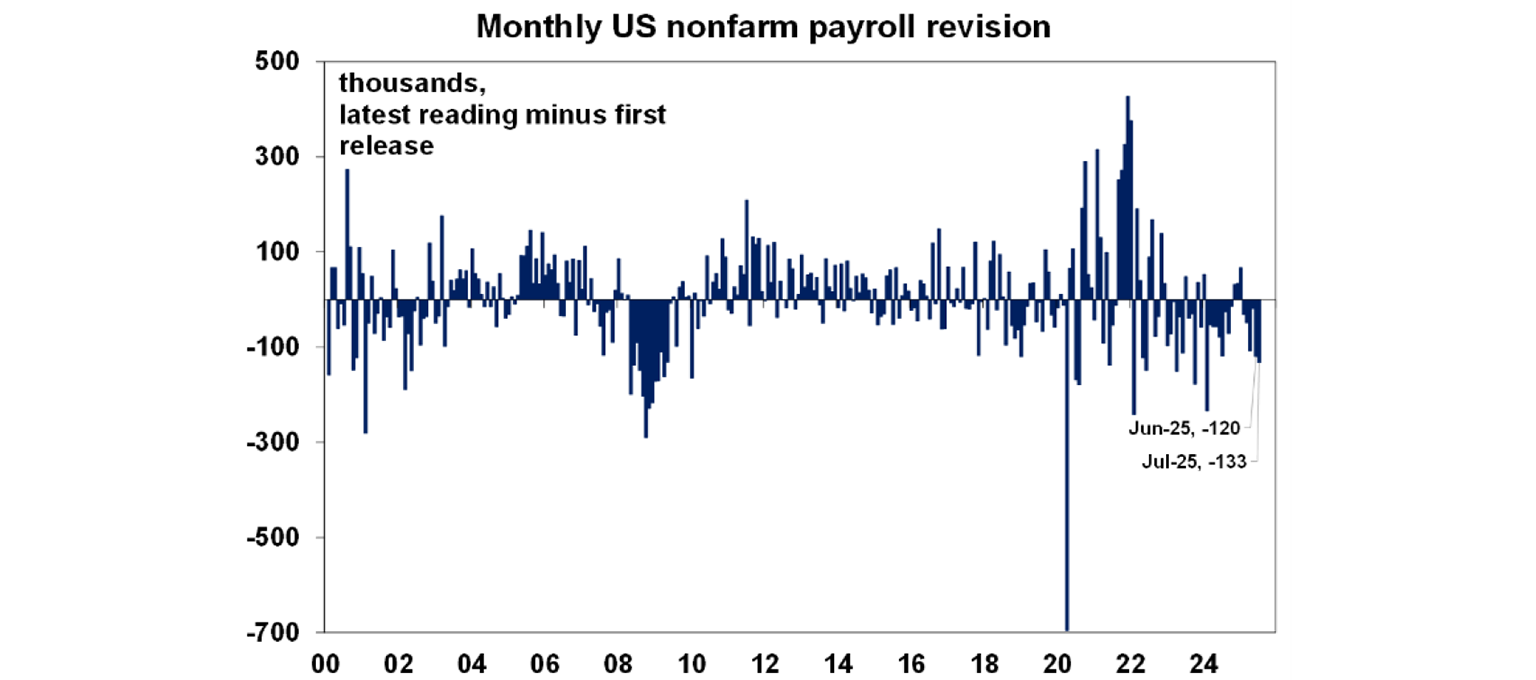
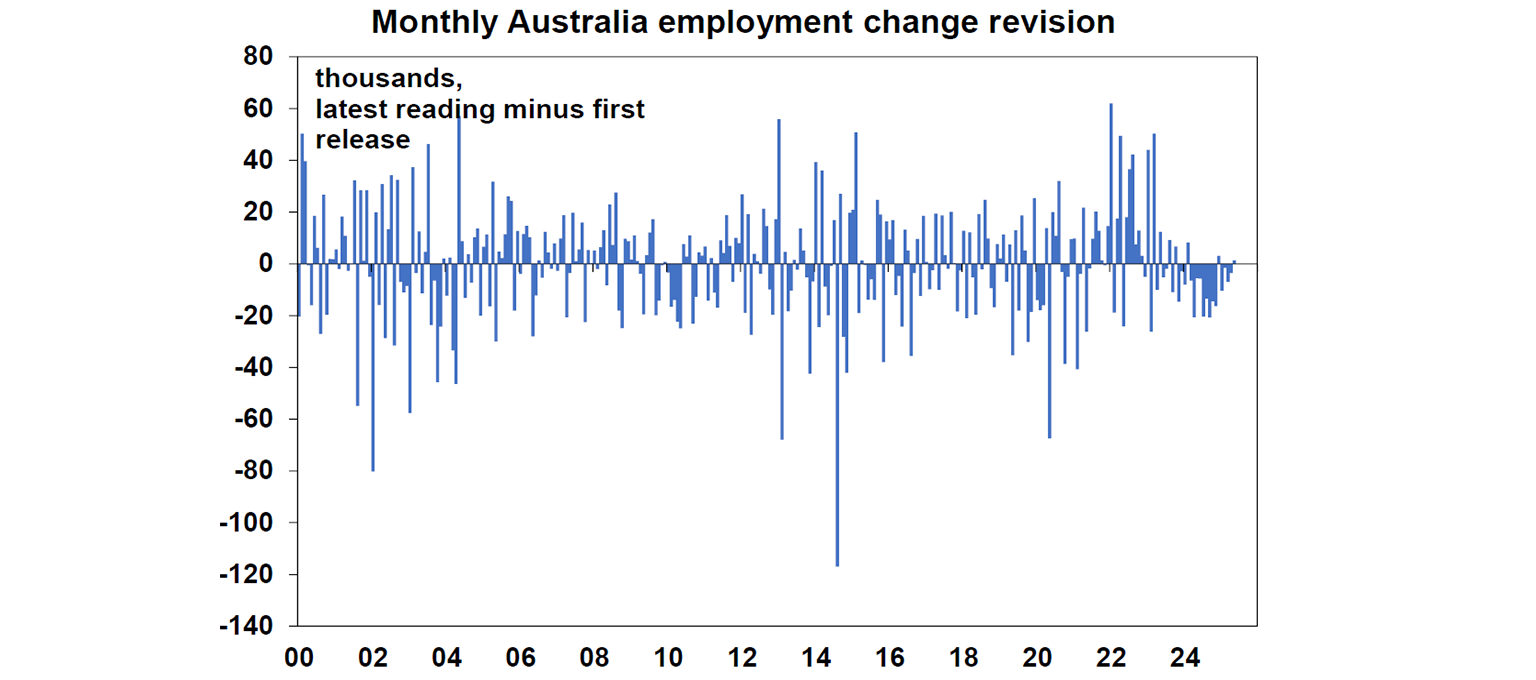
Does Trump have a point with firing the head of the Bureau of Labor Statistics? Well of course he doesn’t just because he thinks the data is rigged but there are some things going on with data revisions and data quality. On top of the low growth in July payrolls, May and June payrolls were revised down by a cumulative 253K. Historical revisions to data are normal (see the chart below), but this revision was larger than average, which may be the sign of real slowing in the labour market. Why do revisions happen? My colleague My Bui explains the reasons for this here. Basically its because businesses submit answers late, businesses make mistakes data and businesses close and new ones open, so the Bureau of Labor Statistics has to make assumptions on the surveyed groups which may be changed after it gets finalised data.
Out of interest, Australian labour force surveys are also subject to revisions (and the monthly jobs data bounces around a lot!).
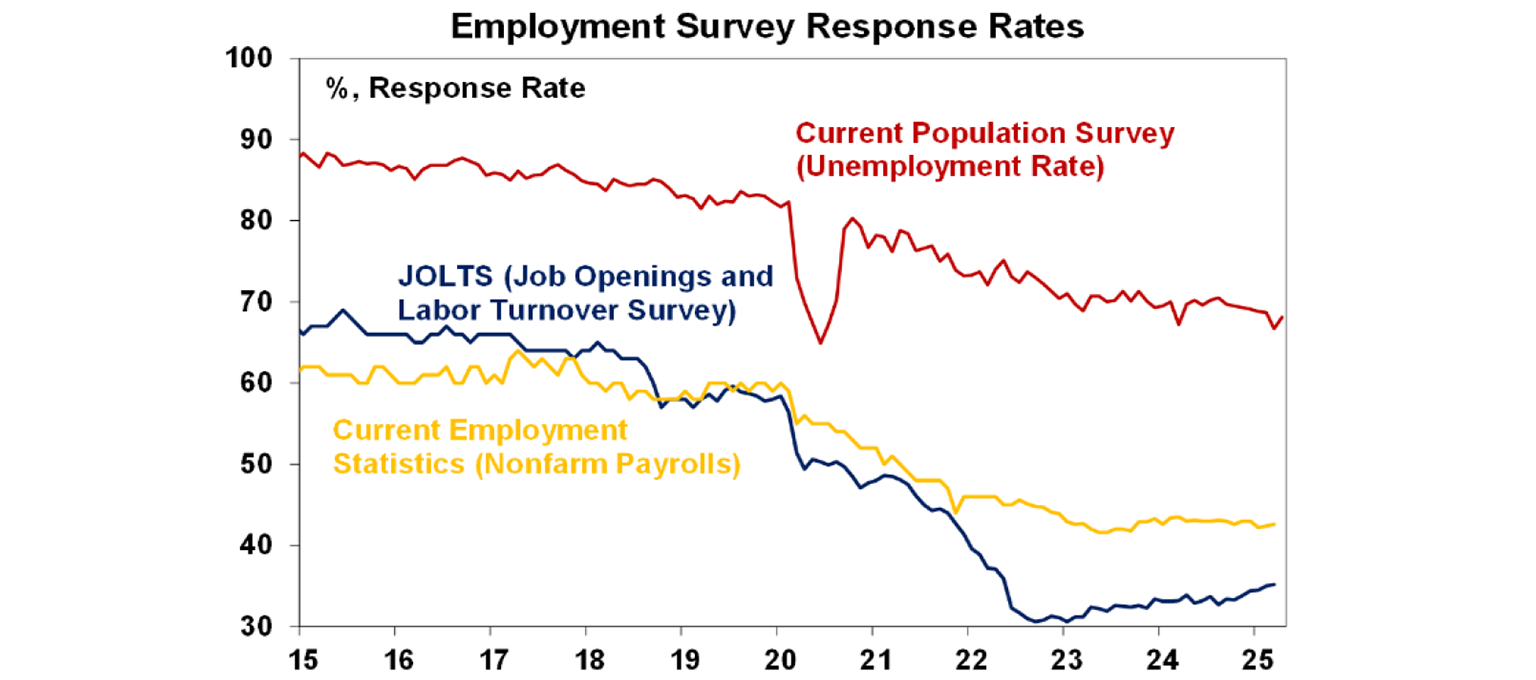
So should we trust the US jobs data. Yes and no. Yes because we get other employment indicators from ADP, Challenger and the employment sub-index of the PMI/ISM (and the downward revisions to jobs means that non-farm payrolls are now tracking closer in line to these indicators!). But, there is a broader problem with a declining response rate for US employment surveys. Response rates have fallen across the board over the past decade (see the chart below), with the non-farm payrolls survey previously having a 60% response rate which has declined to 40%. So, data quality is probably a bit of an issue right now.
It’s not just a “Trumpification” of US data… but also of the Fed! This week Fed Governor Kugler decided to step down early and Trump replaced her with Stephen Miran who is currently the Chairman of the Council of Economic Advisers, an agency withing the White House. Miran is not very well known to markets, but he has been a critic of the Fed before calling for reform to the Fed’s structure, arguing that their current system facilitates groupthink. Miran is considered a “temporary” replacement until he is confirmed by the Senate in January or Trump may decide to reappoint him to the Chair role when Powell’s term expires in May. Although, markets are increasing expecting Christopher Waller (a current member of the Fed Board) to become Fed Chair. The expectation is that Miran will be a dovish board member, arguing and voting for lower rates. Although we wouldn’t say that the current Fed Board or Powell in particular is overly hawkish, its just that the Fed is cautious on cutting rates due to upside inflation risks from higher tariffs.
Major global economic events and implications
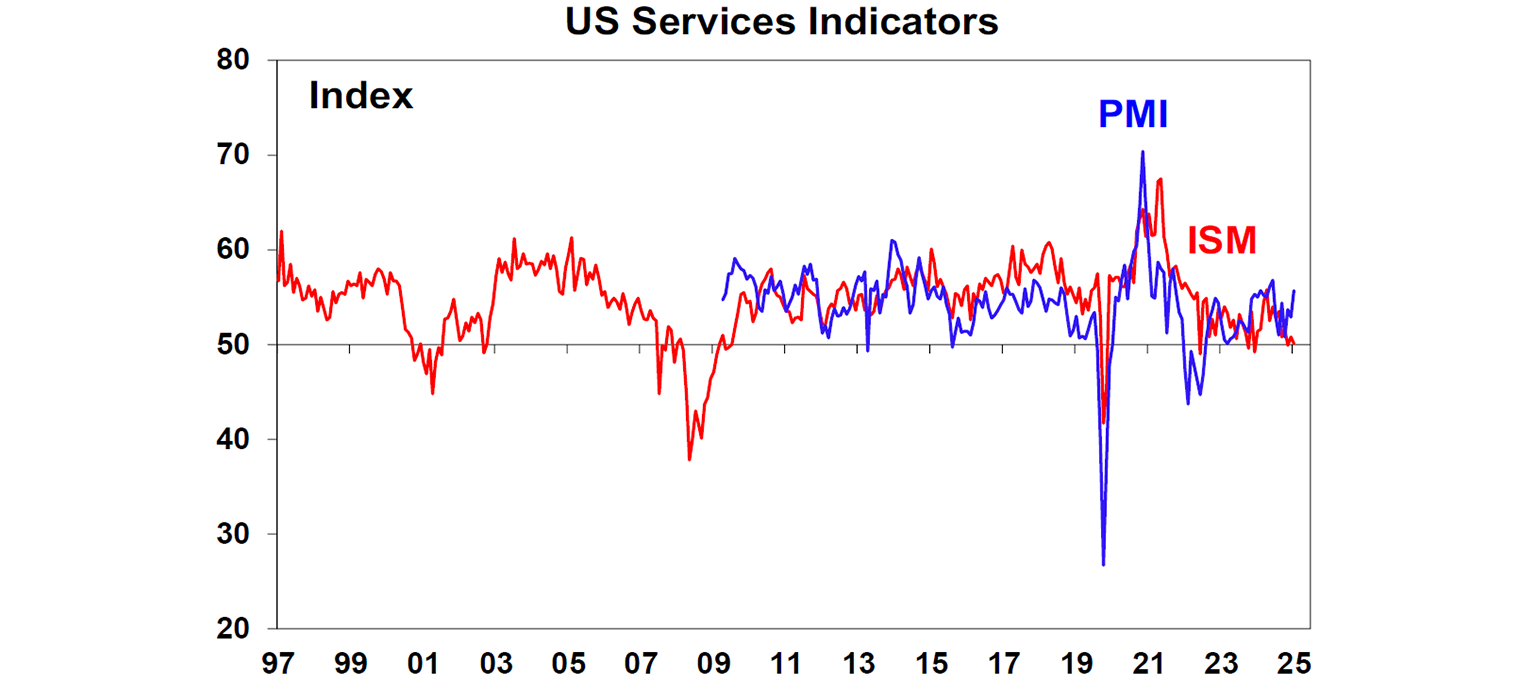
The US services ISM led to stagflation concerns, after the index weakened in July to 50.1 from 50.8 last month. The employment sub-index was weak and new orders also declined but the prices paid component was elevated. However, its probably a little to soon to get concerned about a significant weakening in US GDP growth as the alternative services PMI reading was stronger (see the chart below) and the reading is still around neutral (and not negative).
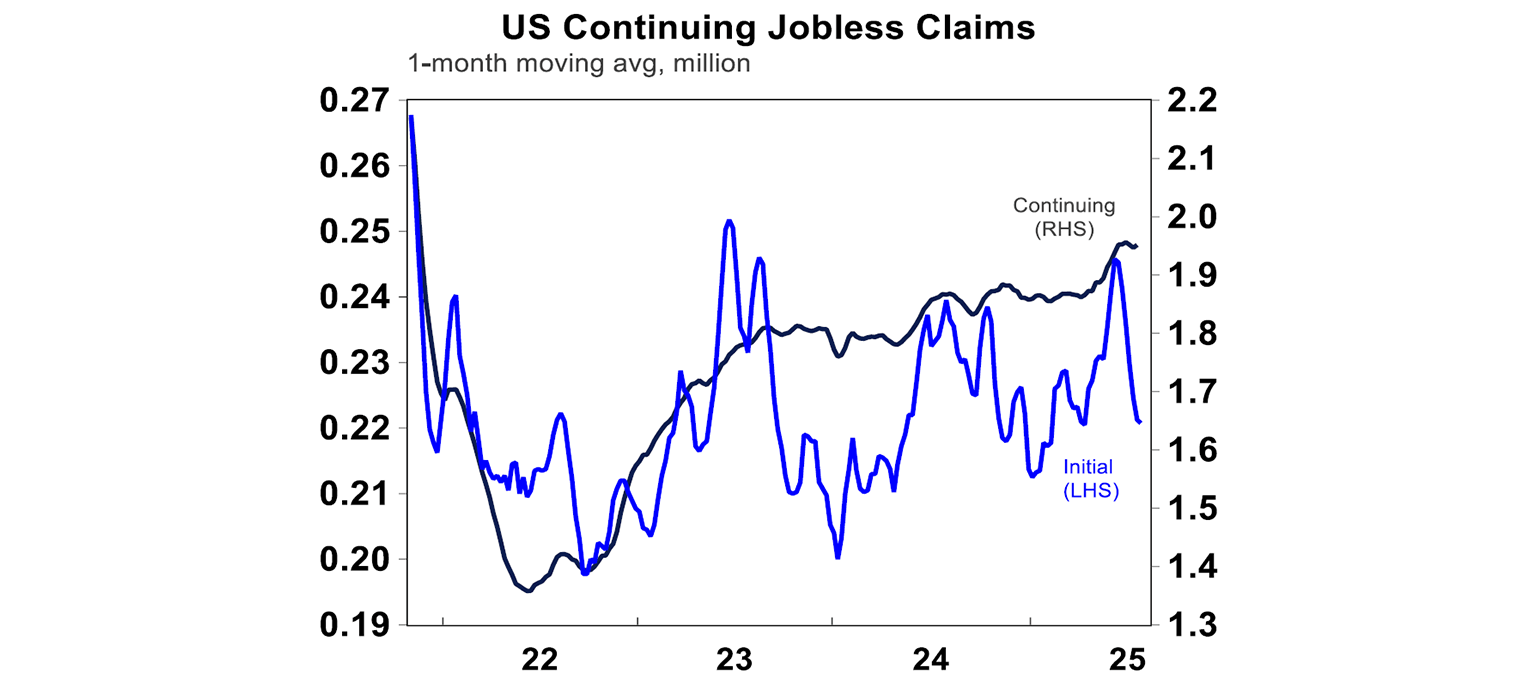
Continuing jobless claims rose to their highest level since 2021 while initial jobless claims are still low (see the chart below) which indicates that its harder for those unemployed to find work, but at least there are not too many new unemployed persons.
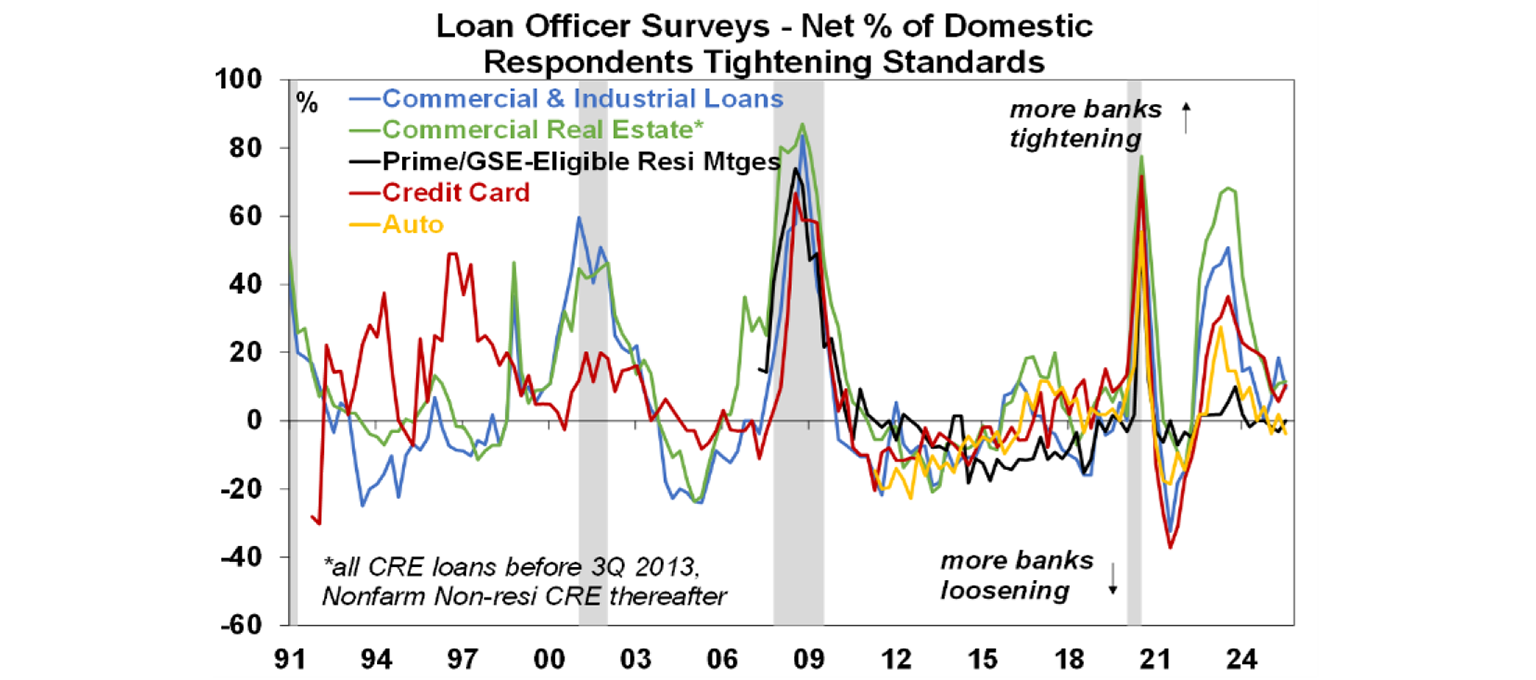
The US Fed’s Senior Loan officers survey showed that lending standards are still tight for commercial and industrial loans and commercial real estate but loosened for credit cards and autos.
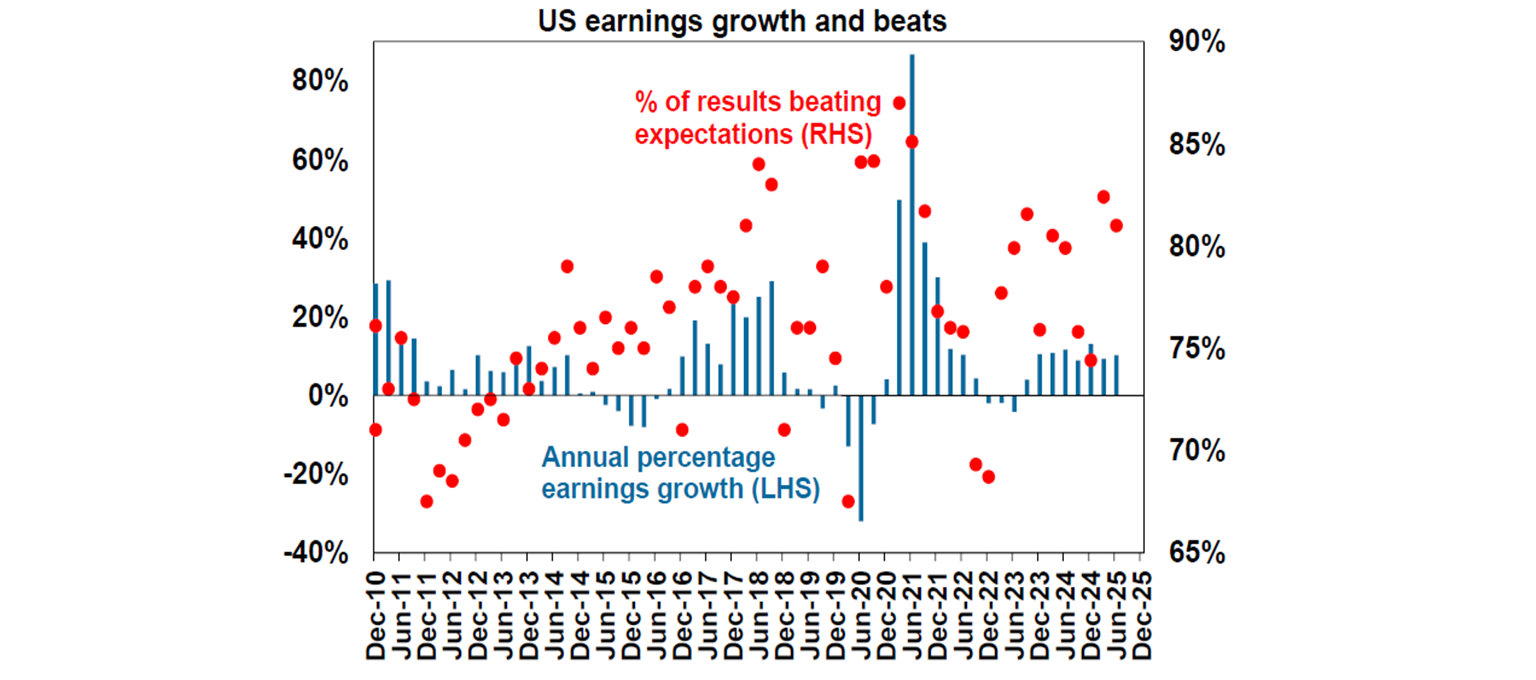
US June quarter earnings season has nearly finished. Around 91% of US companies have now reported and average earnings growth has averaged at 10% and 81% of companies have beaten expectations (a little below the historical average of 76%). Tech companies are reporting 25% earnings growth while ex-tech is lower at 4%, but either way these are not numbers that are pointing to an economic downturn.
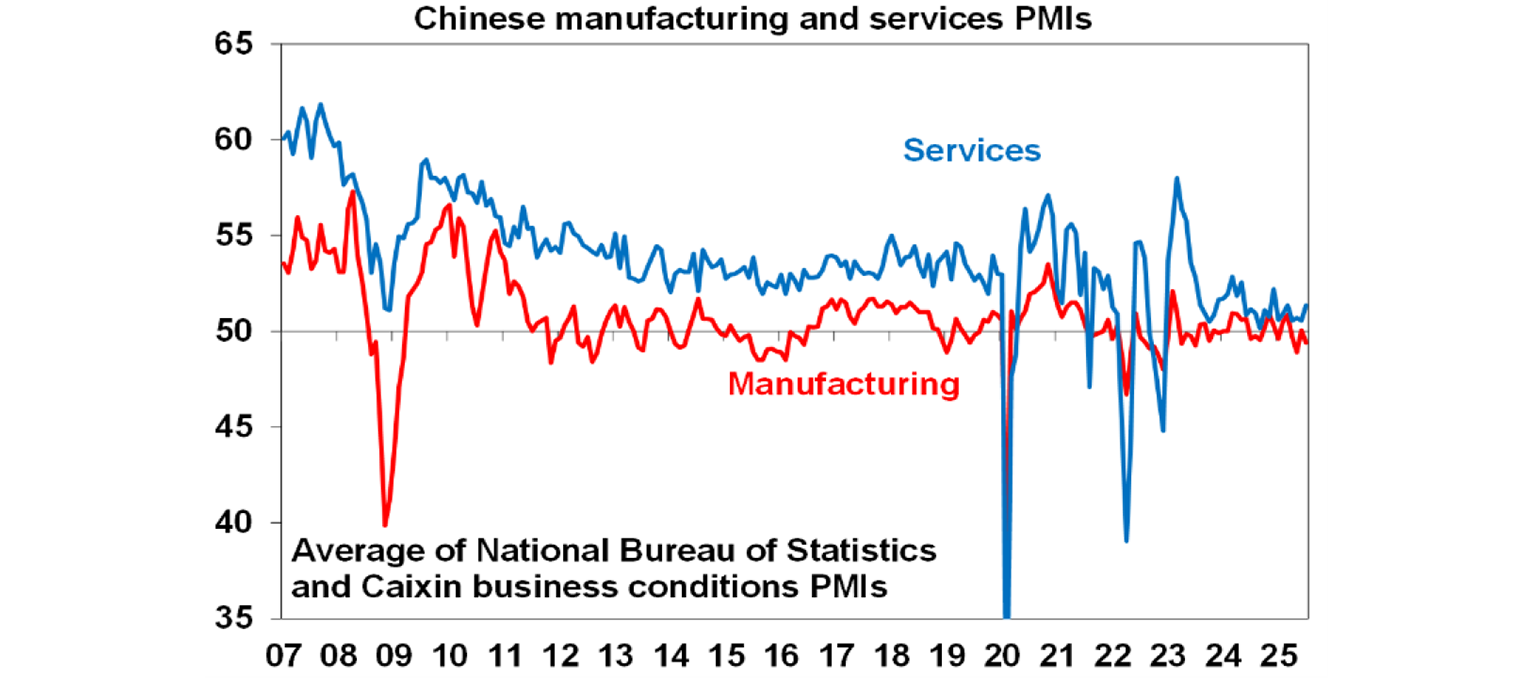
The Chinese S&P Composite PMI fell to 50.8 from 51.3 in July, driven by the decline in the manufacturing component. The services component improved to 52.6 in July, from 50.6 last month which is stronger than the signal from the “official” PMI measure.
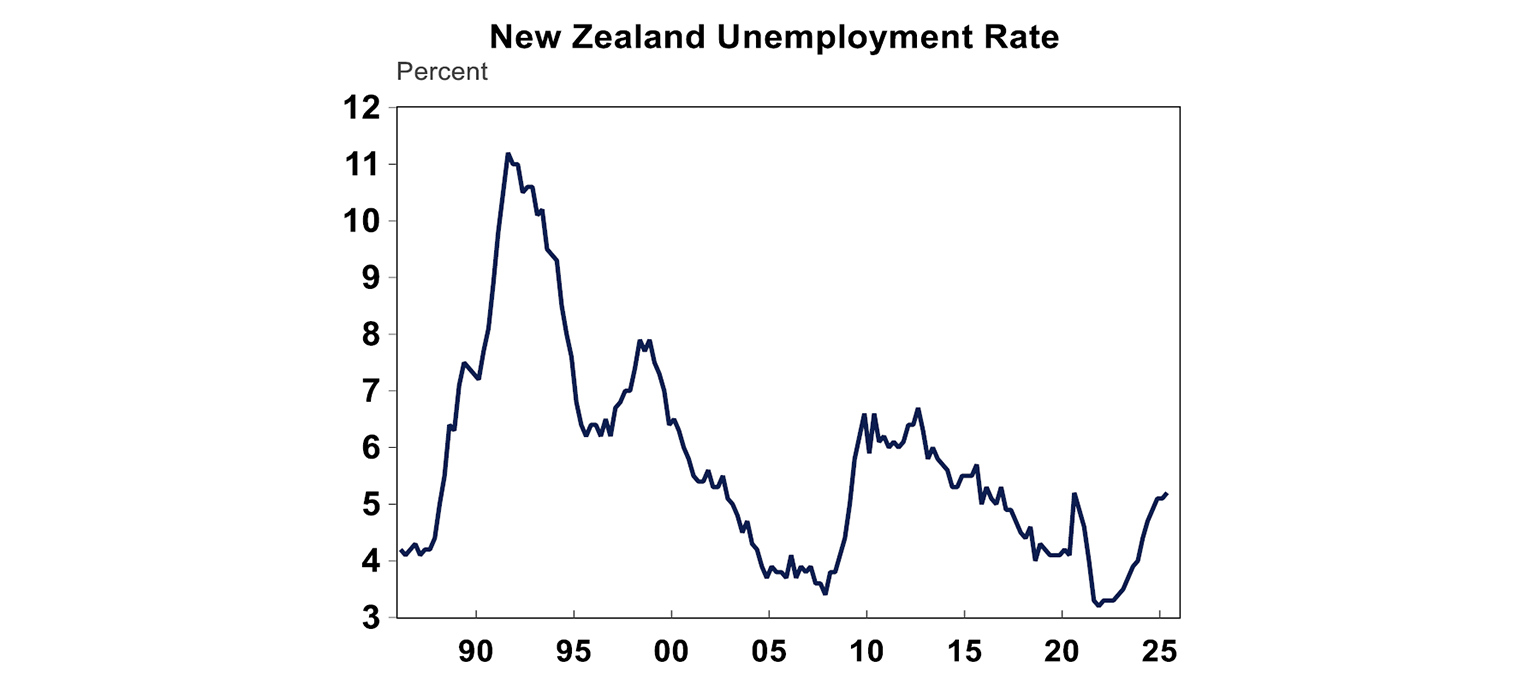
The New Zealand unemployment rate rose to 5.2% in the June quarter (from 5.1% last quarter), a touch better than expected. The NZ unemployment rate is running at its highest level since 2016 (outside of the pandemic) as the economy has slowed, but from here the unemployment rate is expected to flat-line.
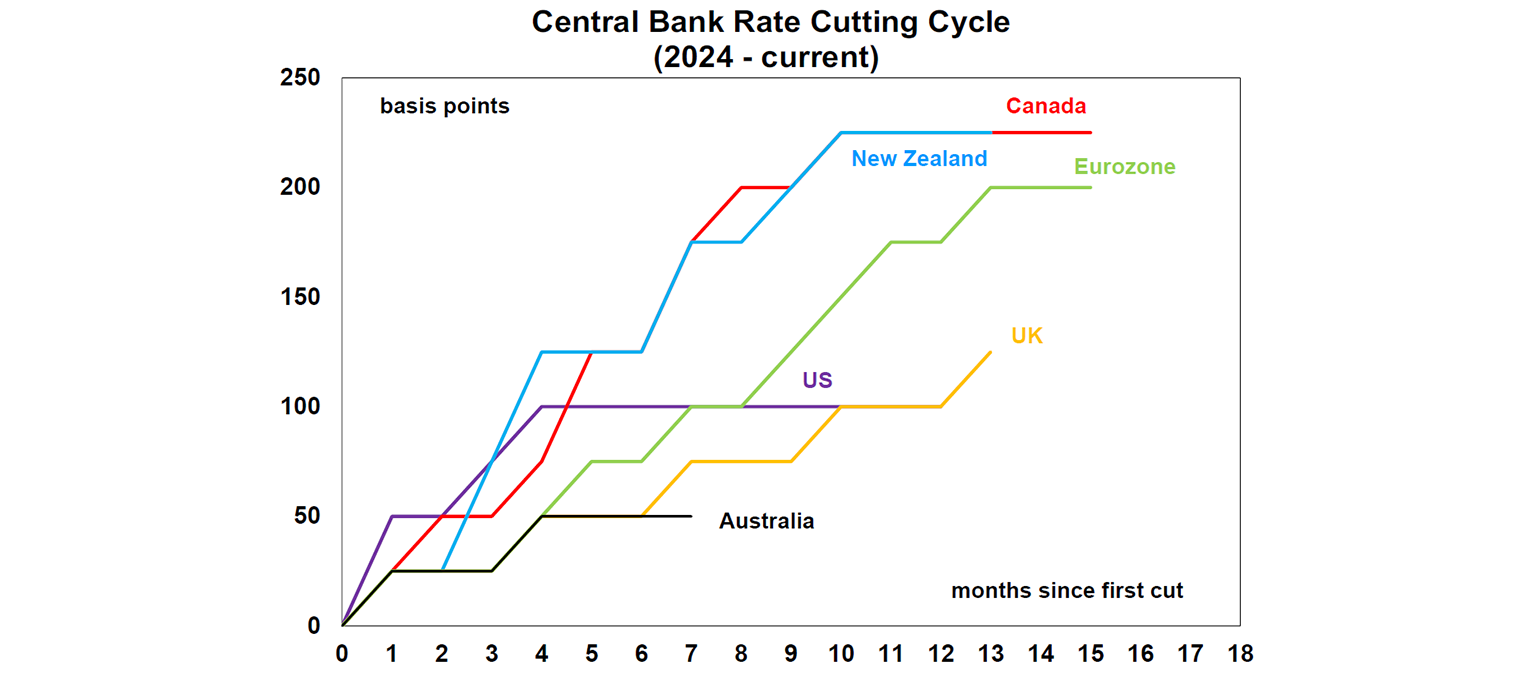
The Bank of England met and cut interest rate by 25 basis points, taking the policy rate to 4% and taking total interest rate cuts to 125 basis points, at the lower end of other central bank rate cuts (see the chart below). It was seen as a hawkish cut, as four (out of nine) members opted to keep rates unchanged. So, expect a slower cutting cycle from here and potentially no further rate cuts this year.
Australian economic events and implications
The household spending indicator rose by 0.5% over the month of June or 4.8% over the year. Volumes rose by 0.7% over the quarter with the largest increases in recreation and culture, hotels, cafes and restaurants, transport and household furnishings and there was a large fall in alcohol & tobacco volumes (due to high tobacco prices from the excise pushing people onto the black market!) and a decline in clothing and footwear volumes. Qld volumes were also a bit stronger, after the cyclone rebuild. All up, this was a stronger signal compared to the monthly retail sales data and means that household consumption will make a positive contribution to the June quarter GDP data and could be the sign that consumer spending is finally turning up.

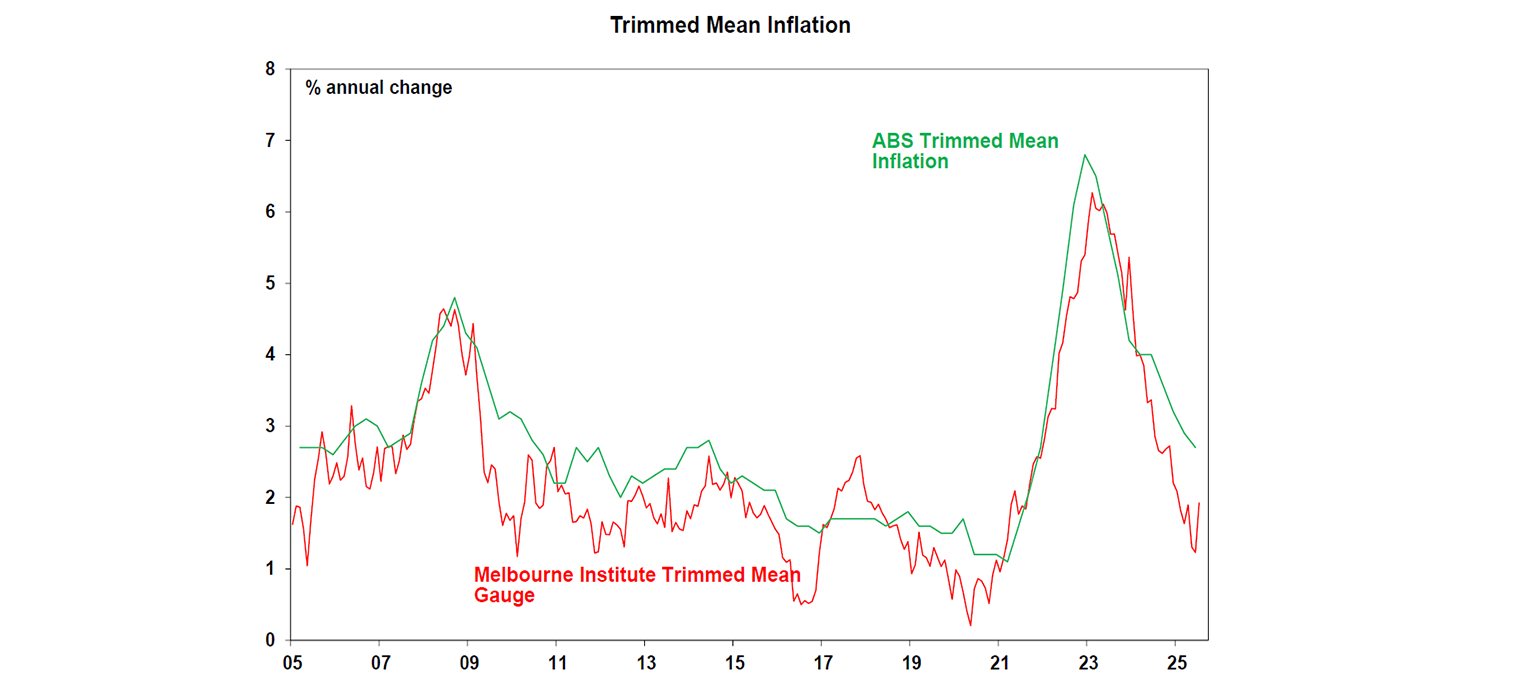
The Melbourne Institute inflation indicator was higher in July, up 0.9% over the month with the annual reading increasing to 2.9%, but this is after a few months of low readings. The trimmed mean indicator bounced up, but is still tracking well below the official quarterly trimmed mean numbers.
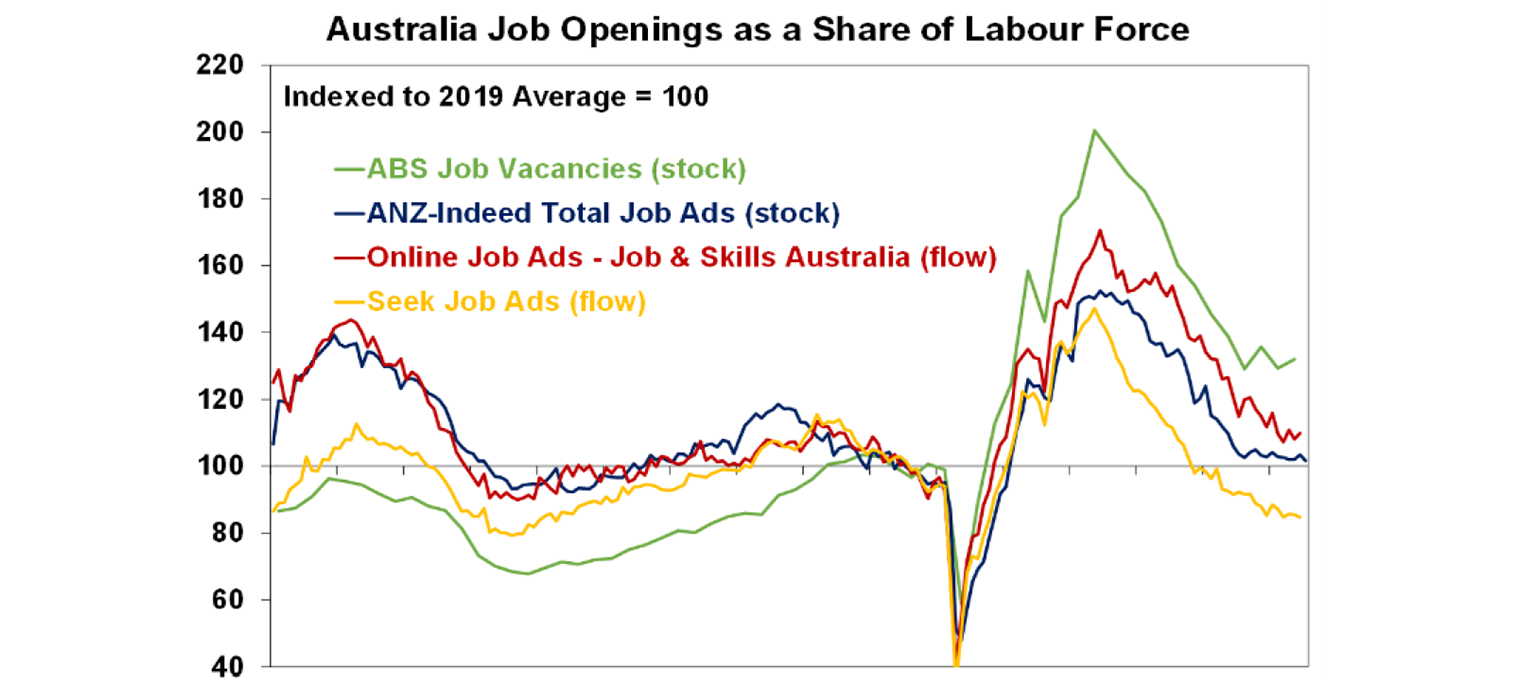
The ANZ job ads data fell by 1% in July and over the year were basically flat, up by 0.1% which is a sign of a cooling in the labour market, in line with other data, but not a collapse and is tracking lower than the ABS job vacancy figures.
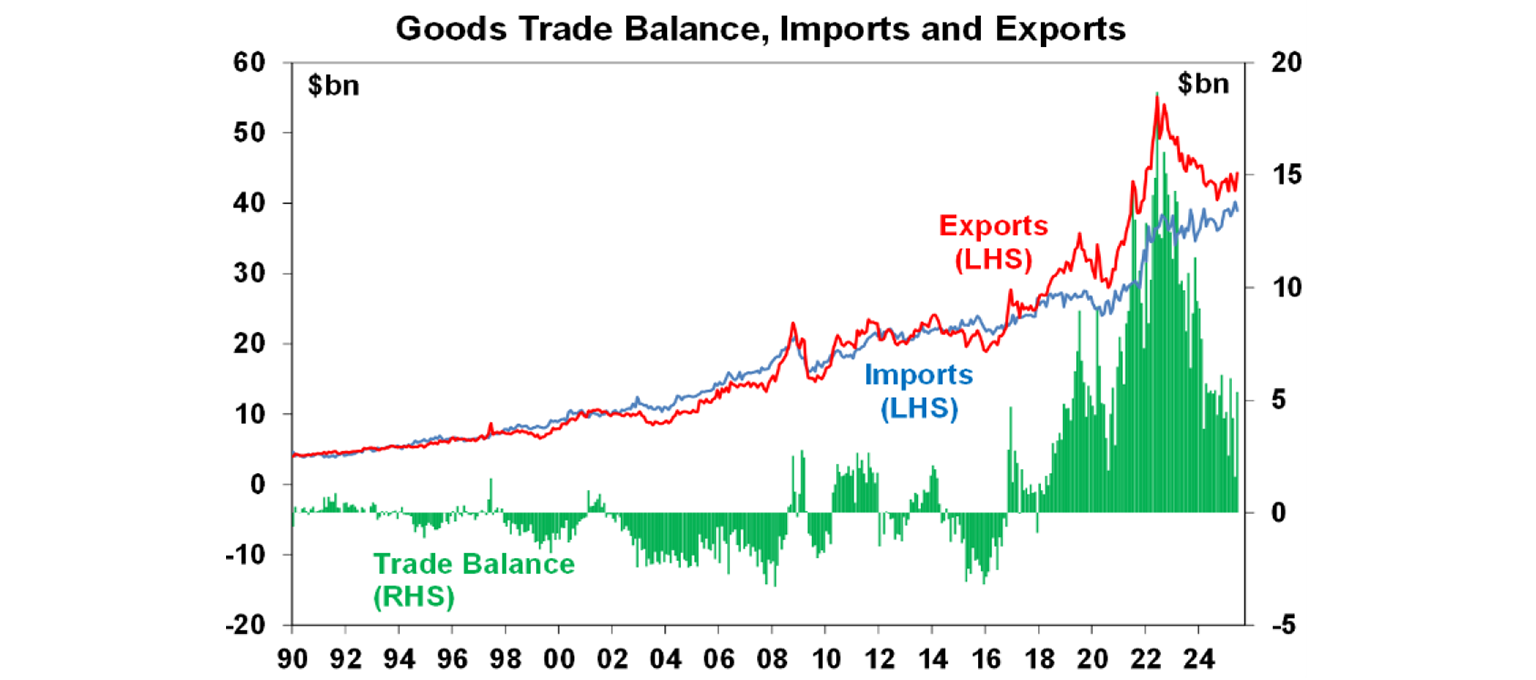
The July trade balance was stronger than expected, up to $3.8bn in June with large one-offs like a big rise in coal and non-monetary gold. Australia has been running a large trade surplus in recent years, helping to keep net exports as a contributor to GDP growth.
What to watch over the next week?
The Reserve Bank of Australia meet on Tuesday and the RBA will also release updated forecasts in the “Statement on Monetary Policy”. The Board is expected to cut the cash rate by 25 basis points, from 3.85% to 3.6% - the cut that should have happened last month! We think the Monetary Policy Board will vote 9-0 to reduce the cash rate by 25 basis points because the inflation data that the board was waiting for last month to confirm its forecasts came in close to expectations, with the trimmed mean up by 2.7% over the year to June (RBA was looking for 2.6%). Actually, the June quarter inflation data showed both the headline and the trimmed mean sustainably within the 2-3% inflation target for the first time in the target band since 2014! On the RBA’s forecasts, we think they will show relatively few adjustments. Trimmed mean inflation is expected to remain around the middle of the target band over the forecast period, the unemployment rate is still expected to peak at 4.3% (on the RBA’s estimates) but near-term GDP may get revised up a little thanks to stronger consumer spending.
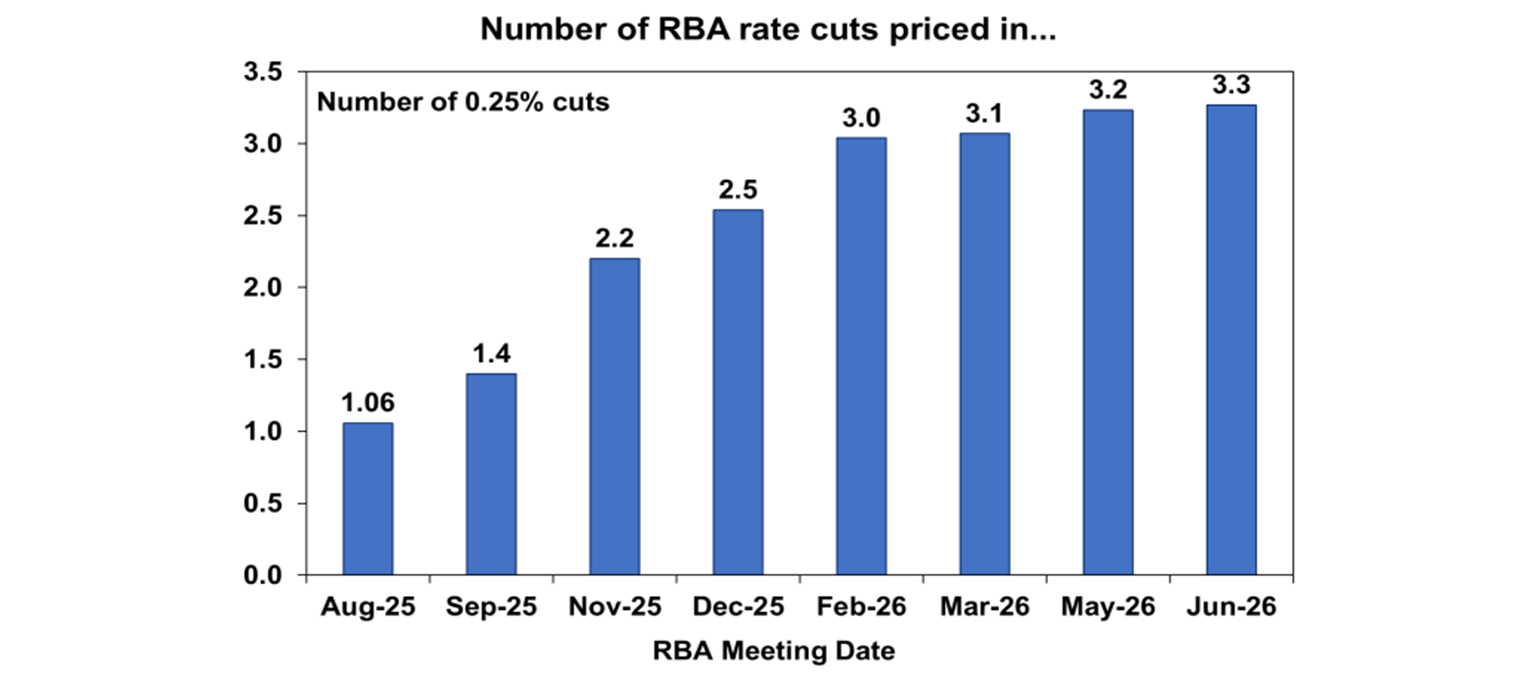
Looking ahead, we expect a total of 100 basis points in this cycle (including one in August). This would mean that the cash rate settles at 2.85% at the end of the cutting cycle. Markets are expecting another ~3 rate cuts from here (see the chart below).
The Board see the current level of interest rates as “modestly restrictive”. With another cut likely next week, we would still call the level of interest rates as slightly restrictive, but we think that the RBA will still sound cautious on giving too much forward guidance and remain of the view that interest rates do not need to be aggressively cut for now, given their concern that upside inflation risks may occur again in Australia.
In Australia, there is also the NAB business survey on Tuesday wages data on Wednesday (we expect a 0.8% increase to the wage price index in the June quarter with annual growth at 3.3% and the July labour force on Thursday (we are looking for jobs growth around 30K and the unemployment rate to come back to 4.2% from 4.3% last month).
The US consumer price index for July (Tuesday) is expected to show a 0.2% rise or 2.8% year on year (from 2.7% last month) and core at 3.0% as tariff impacts continue to be passed through to consumers. July retail sales (Friday) should show a modest rise of 0.5% and University of Michigan consumer sentiment index.
(Friday) will give an update on consumer inflation expectations which have been increasing significantly.
Japanese second quarter GDP (Friday) is expected to be up just 0.3% on an annualised basis (although this is up from a negative last quarter), which argues for the Bank of Japan to be careful in lifting interest rates.
Chinese July industrial production (Friday) should show solid growth, property investment (Friday) is still down by over 11% since the beginning of the year and the jobless rate (Friday) should be low at 2.7%.
Outlook for investment markets
Share markets are at risk of a correction through the seasonally weak months of August and September given stretched valuations and risks around US tariffs and US debt and likely weaker growth and profits. But with Trump pivoting towards more market friendly policies and central banks, including the Fed and RBA, likely to cut rates further, shares are likely to provide reasonable gains into year end.
Bonds are likely to provide returns around running yield or a bit more, as growth slows, and central banks cut rates.
Unlisted commercial property returns are likely to improve as office prices have already had sharp falls in response to the lagged impact of high bond yields and working from home.
Australian home prices have started an upswing on the back of lower interest rates. But it’s likely to be modest initially with poor affordability and only gradual rate cuts constraining buyers. We see home prices rising around 6% this year.
Cash and bank deposits are expected to provide returns of around 3.75%, but they are likely to slow as the cash rate falls.
The $A is likely to be buffeted in the near term between the negative global impact of US tariffs and the potential positive of a further fall in the overvalued US dollar. Undervaluation should support it on a medium-term view with fair value around $US0.73.
You may also like
-

Oliver's insights - Why have Australian living standards “fallen” and how do we fix it? For the last few years there has been much talk of a “cost-of-living” crisis in Australia and of “falling living standards”. This has flared up again lately with the pickup in inflation resulting in a renewed fall in real wages. -

Weekly market update - 10-07-2026 Ceasefire over but markets are also over the war, Why oil prices can't go too low or too high, Is AI adding to inflation risk or taking it away, and Australia’s wage problem. -

How to protect yourself from phishing and impersonation scams Phishing scams can look like everyday messages – emails, texts or calls. Learn the signs and simple steps to protect your money and personal information.
Important information
Any advice and information is provided by AWM Services Pty Ltd ABN 15 139 353 496, AFSL No. 366121 (AWM Services) and is general in nature. It hasn’t taken your financial or personal circumstances into account. Taxation issues are complex. You should seek professional advice before deciding to act on any information in this article.
It’s important to consider your particular circumstances and read the relevant Product Disclosure Statement, Target Market Determination or Terms and Conditions, available from AMP at amp.com.au, or by calling 131 267, before deciding what’s right for you. The super coaching session is a super health check and is provided by AWM Services and is general advice only. It does not consider your personal circumstances.
You can read our Financial Services Guide online for information about our services, including the fees and other benefits that AMP companies and their representatives may receive in relation to products and services provided to you. You can also ask us for a hardcopy. All information on this website is subject to change without notice. AWM Services is part of the AMP group.