


Weekly market update
Investment markets and key developments
While there were no specific changes to US tariff rates this week , Trump and his team never fail to produce material for us to digest. The TACO (Trump Always Chickens Out) trade continued, with shares up this week despite all the background chaos, Trump and China President Xi agreed to further trade talks and Trump signed a travel ban for 12 countries because of concerns around national security.
11 min read

I don’t think that a quiet week in markets exists anymore. While there were no specific changes to US tariff rates this week (yay, I was getting sick of updating our tariff chart), Trump and his team never fail to produce material for us to digest. The TACO (Trump Always Chickens Out) trade continued (which basically implies Trump just uses tariffs to negotiate so don’t take them too seriously), with shares up this week despite all the background chaos, Trump and China President Xi agreed to further trade talks and Trump signed a travel ban for 12 countries because of concerns around national security. But the most entertaining thing was the “big beautiful break-up” between Trump and Elon Musk. It made me think of the famous words from Taylor Swift “We are never ever ever getting back together”. After Musk stepped down from his DOGE duties and criticised the OBBBA as a “disgusting abomination”, a full on public feud between the two broke out on social media. Trump criticised Musk over going “crazy” after taking away his EV mandate and threatened to cut Musk’s government contracts which saw Tesla shares slump by 18% before recovering a little. Musk called for Trump to be impeached (again) and said Trump was named in the Epstein files (which are yet to be released). With Musk stepping away from DOGE and the focus going to supporting the OBBBA in the Senate (which is likely to end up including less spending cuts than the House of Representatives bill), it’s hard to see as many job government-related job losses, which is good for the labour market. While all of this noise around the administration and power battles is entertaining, it doesn’t send a lot of confidence about the US economy for investors which is a downside risk for US sharemarkets.
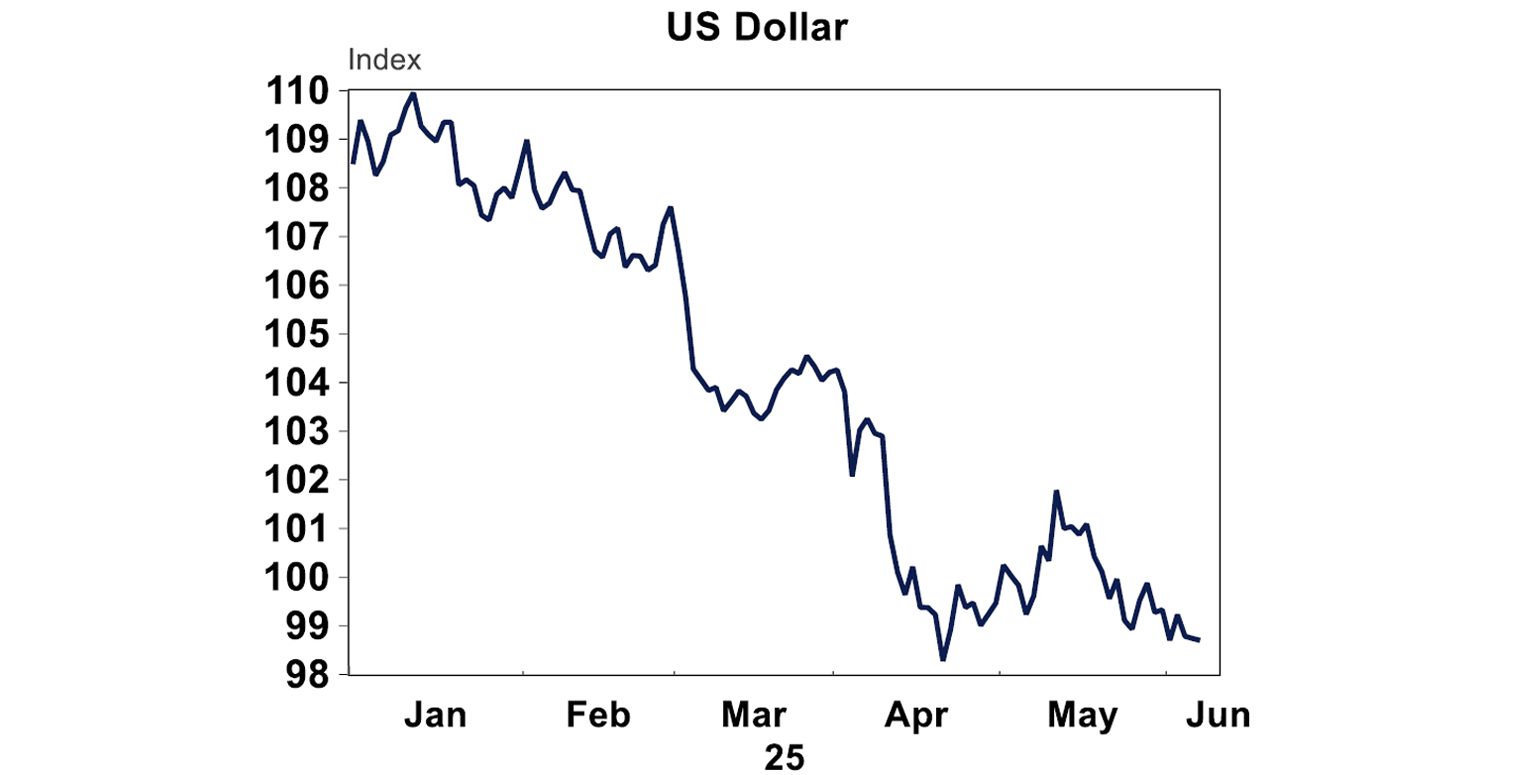
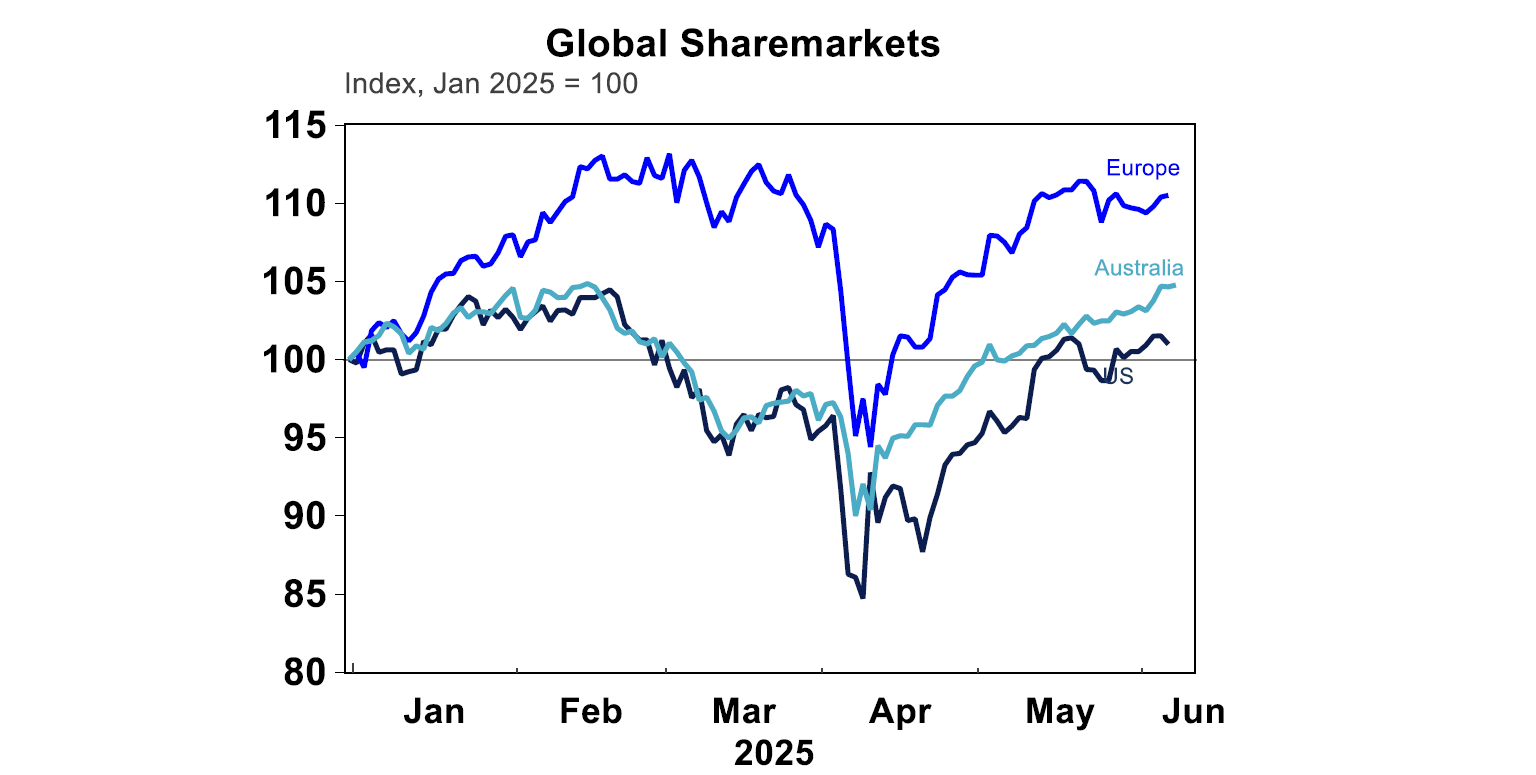
The US S&P500 was up by 1.5% this week, with mixed economic news but certainly nothing that screamed recession. The ASX200 was up by 1.0% higher, European shares also rose while Japanese shares fell. The Aussie dollar is regaining some lost ground, up just under 0.65USD this week. The US dollar fell a tad further this week and is down nearly 10% this year.
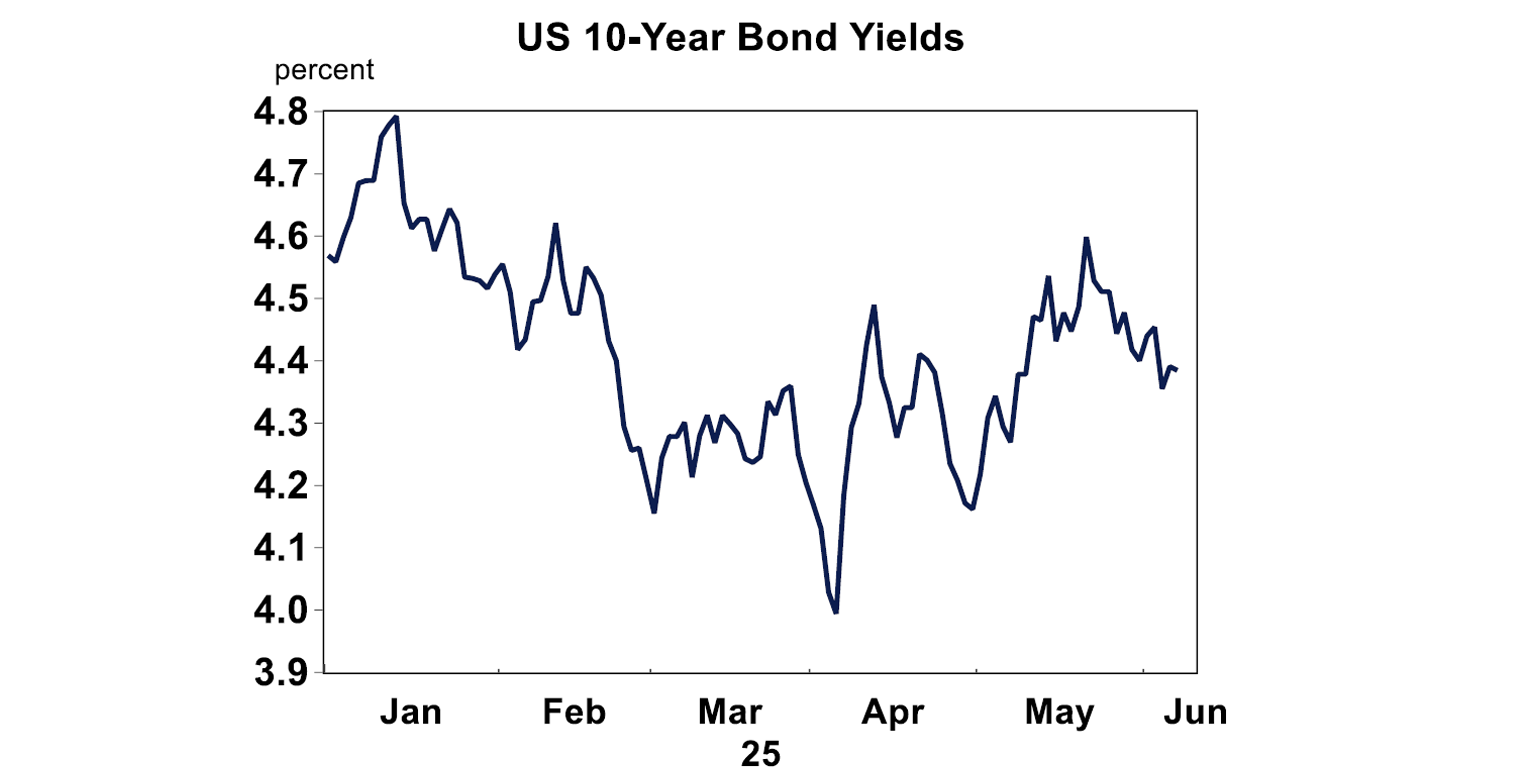
US 10-year bond yields rose again this week to 4.5%, but are down from their highs. It’s hard to see much further downside in yields unless concerns about a growth downturn materialise again. Shane wrote a great note about US public debt concerns and the impacts to bond yields this week.
US sharemarkets have had a massive rally in recent weeks, and are up by 19% since the post-Liberation day lows. It is hard to see this positive momentum continuing when Trump’s tariffs are still up in the air whilst we are in the 90- day pause and the legality of the tariffs is also still in question. US economic data is also likely to start weakening, especially in the hard economic indicators (versus soft measures like surveys) which may get markets worried about a growth downturn. Inflation indicators are also likely to start turning up which may cause concern about stagflation and limit further Fed interest rate cuts. So in the short-term, expect some downside to shares until there is more clarity around when (or even if) trade deals will be finalised. Since the beginning of 2025, European shares have outperformed the US and Australia (see the chart below). This reflects underperformance in 2024, expectations of more fiscal spending this year and better valuations.
Major global economic events and implications
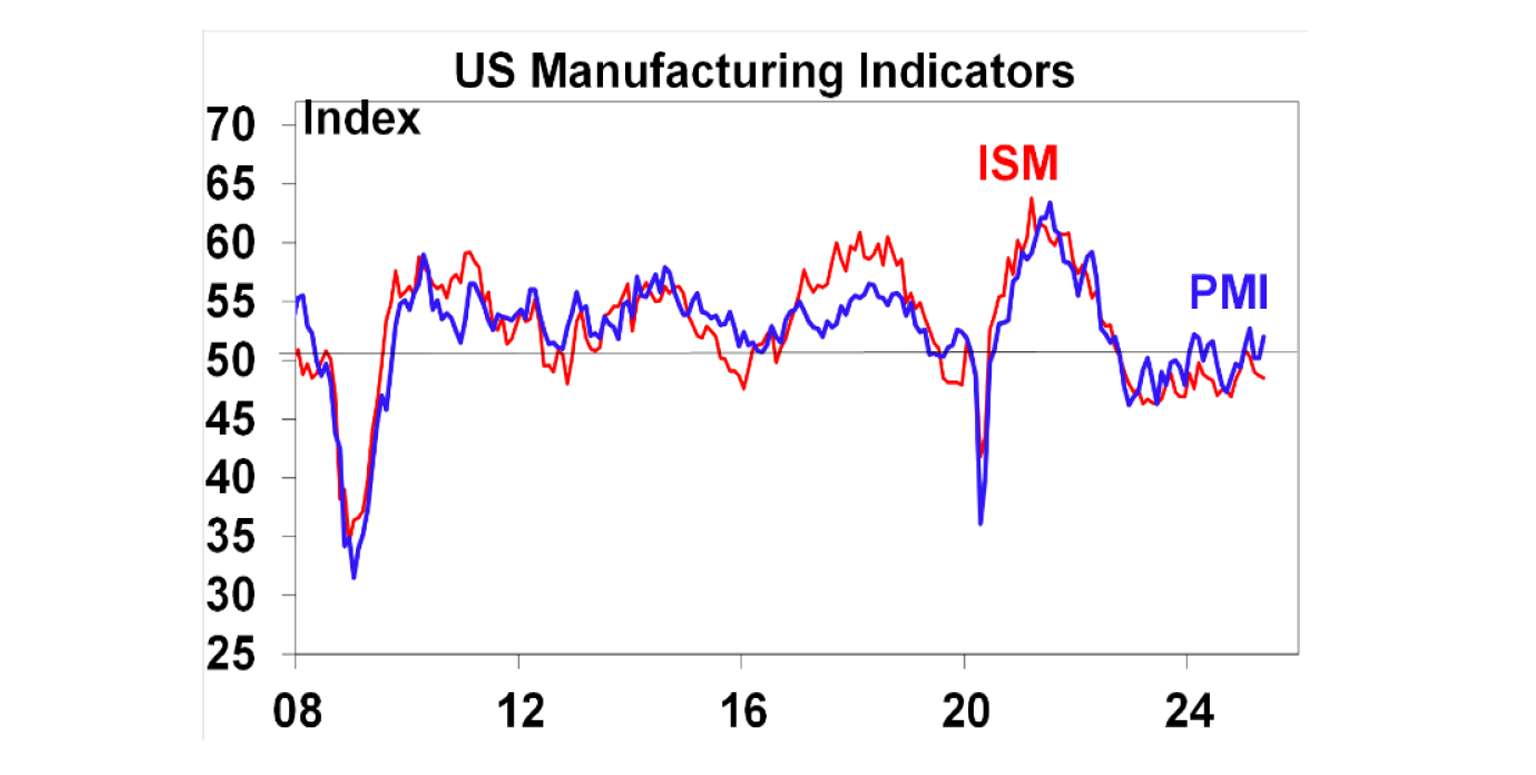
The US ISM manufacturing index for May moderated to 48.5 (from 48.7), with a number below 50 indicating contracting activity. The components showed better new orders and employment, but new export orders fell to similar levels of COVID and the GFC downturns. Supplier delivery times increased, which also appears to have lifted price pressures.
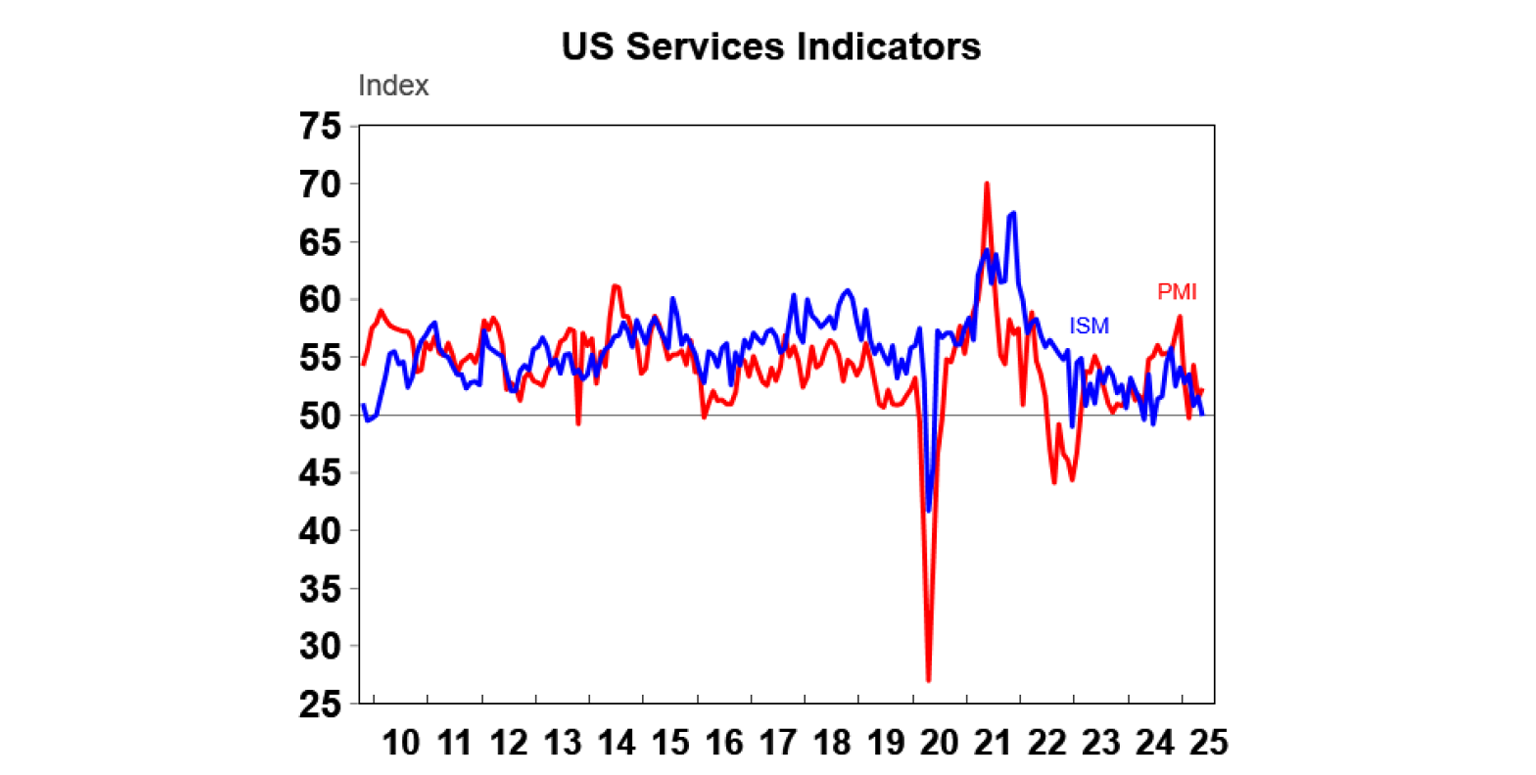
The ISM services index was also poor in May, slipping into contraction at 49.9 (from 51.6 last month). The components showed a collapse in new orders, employment conditions improving and price pressures remaining high which sends a bit of a “stagflation” vibe – high inflation and poor growth, which may put the US Fed into a difficult position.
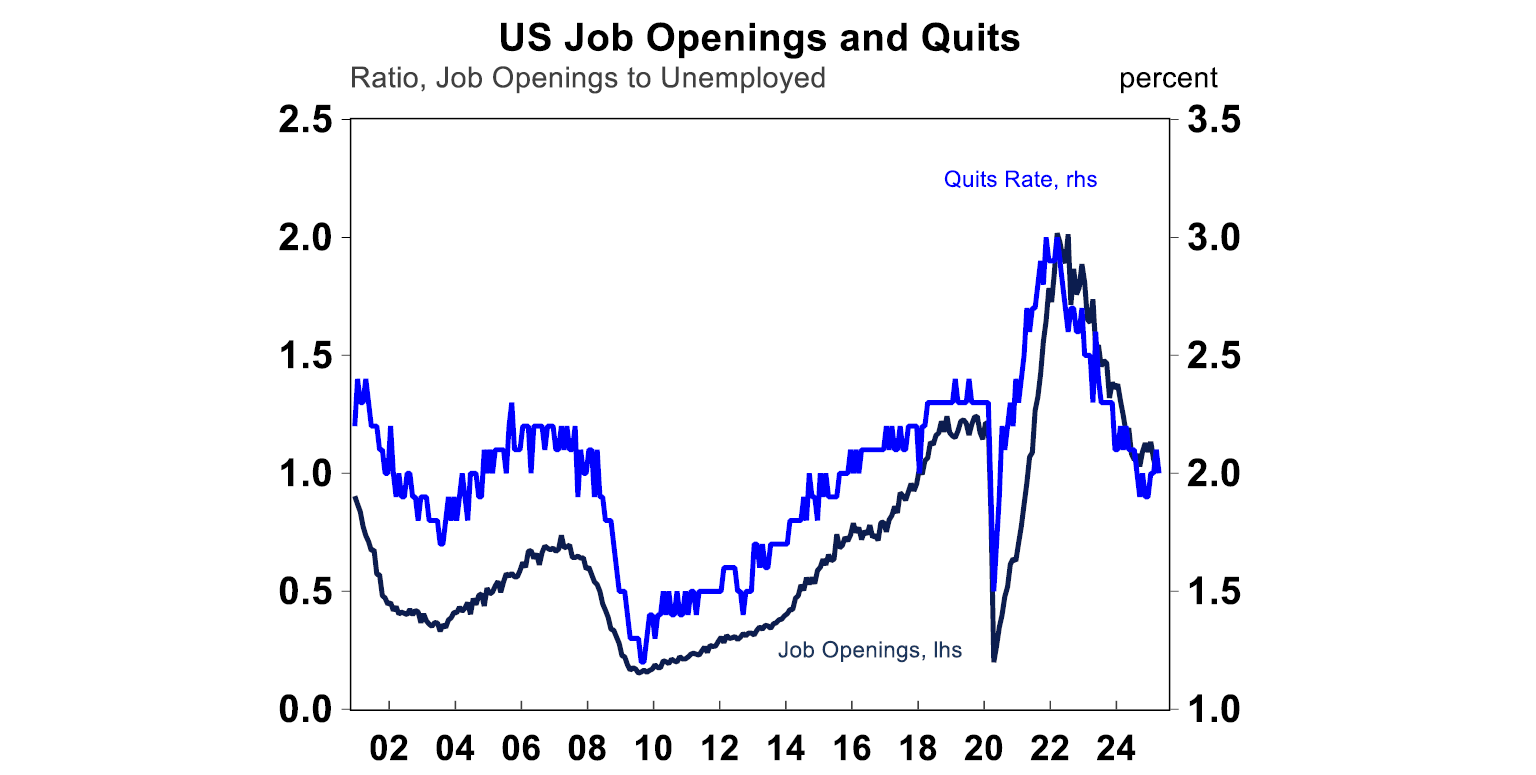
US job openings rose unexpectedly by 191K in April (expectations were for a decline) and the ratio of job openings to unemployed, which is a good proxy for labour market tightness increased slightly and is still over 1 (which means that for every unemployed person there is theoretically one available job). The job quits rate declined slightly to 2% from 2.1%. A lower quits rate could indicate concern that employees are not confident about finding another job, so stay in their role. Despite concerns about DOGE cutting the size of the Federal workforce, the details in the data suggests low hiring and low firing conditions right now, but a further slowing in jobs growth is likely, although perhaps it won’t be as many job cuts with Elon Musk now no longer leading DOGE policy.
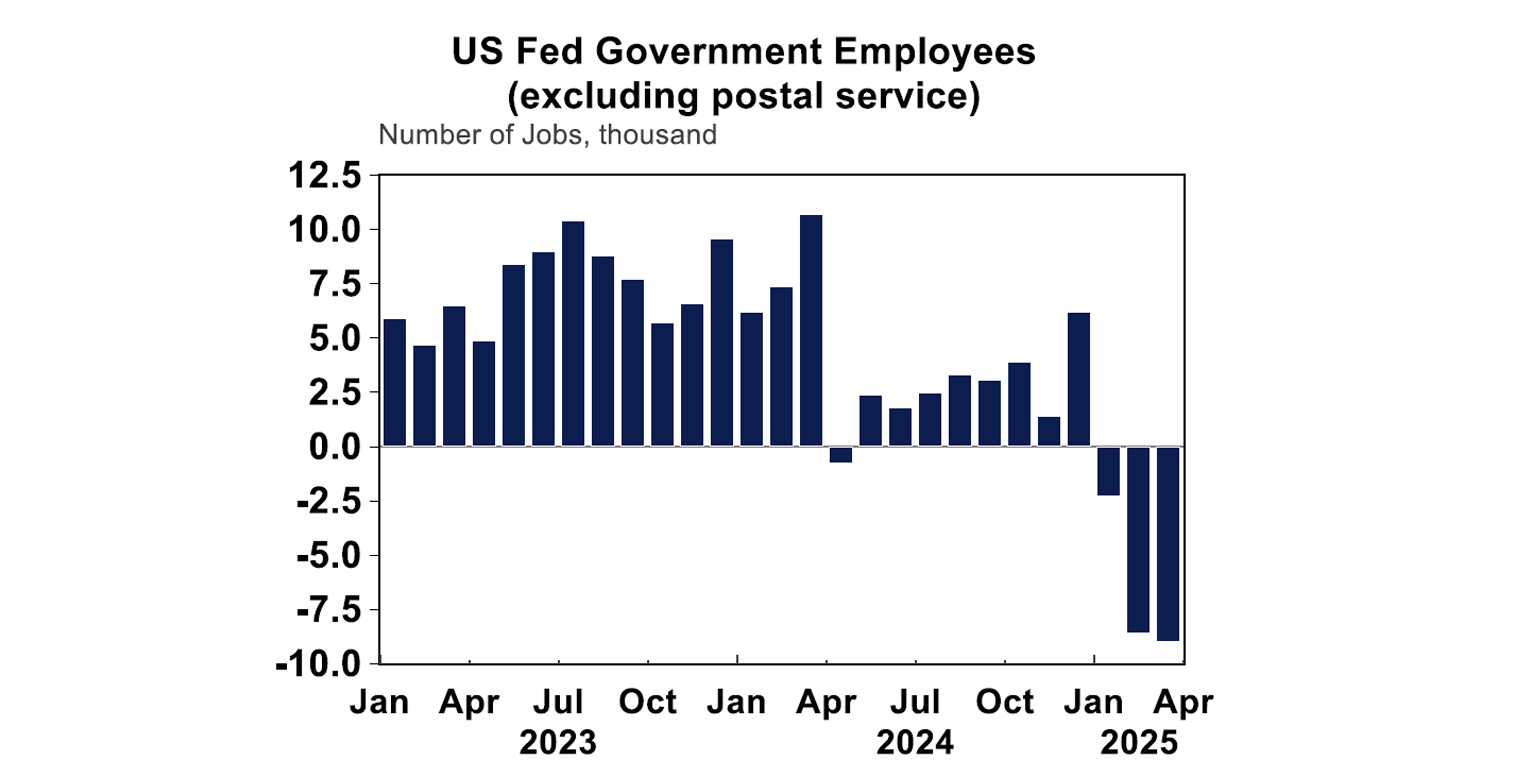
May non-farm payrolls rose by 139K, despite expectations for a 126K lift. Job gains were concentrated in healthcare, leisure and hospitality and social assistance. Federal government jobs fell again (see the next chart), by 9K in one month.
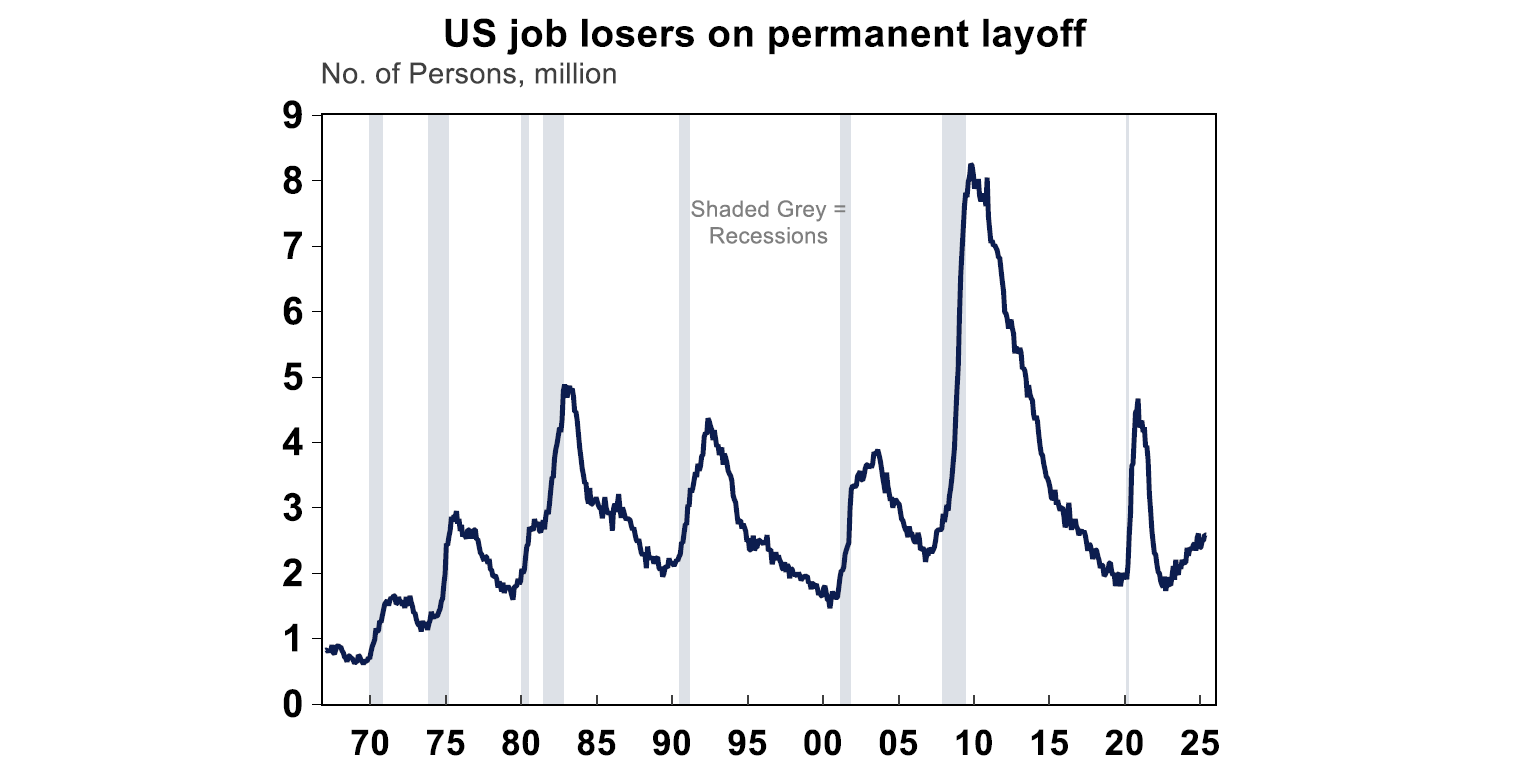
The unemployment rate remains at 4.2% which is still fairly low, although the number of employees on permanent layoff continues to rise (see the chart below). So all up, we are seeing a slowing in the US jobs market.
The May Beige Book, which is a commentary on economic conditions by the various Federal Reserve districts showed a pretty subdued outlook on the US economy. Economic activity looks to have “declined slightly” across the districts, uncertainty was high with hiring decisions delayed for now and prices were increasing at a “moderate pace”. All up, this argues for the US Fed to remain on hold.
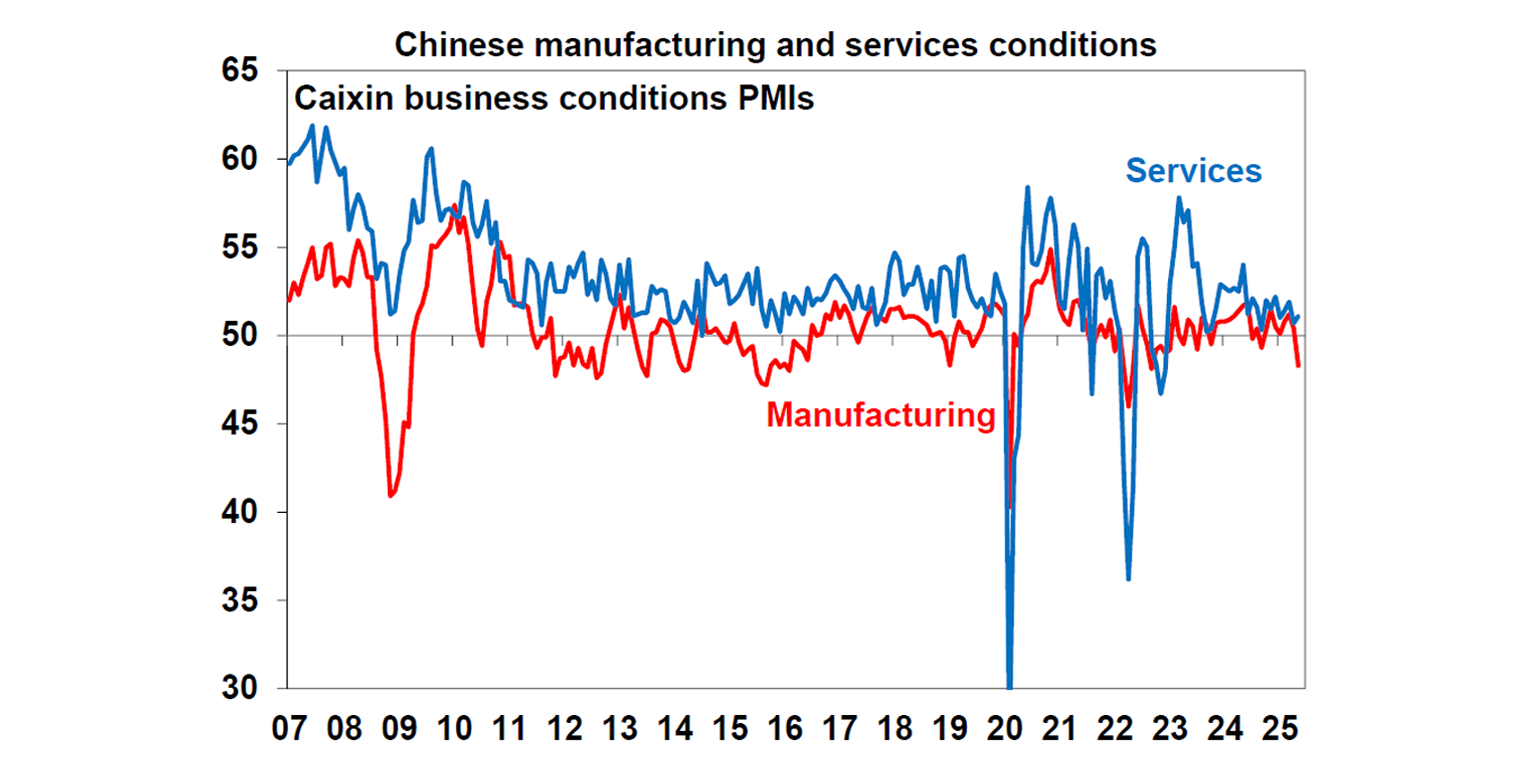
The Chinese Caixin manufacturing PMI fell to 48.3 in May (down from 50.4 last month) which indicates a contraction in activity. However, the services reading was better, up to 51.1 in May (from 50.7 last month). So, mixed readings on conditions in the Chinese economy and there are no clear impacts (yet) of trade-related disruptions to exports.
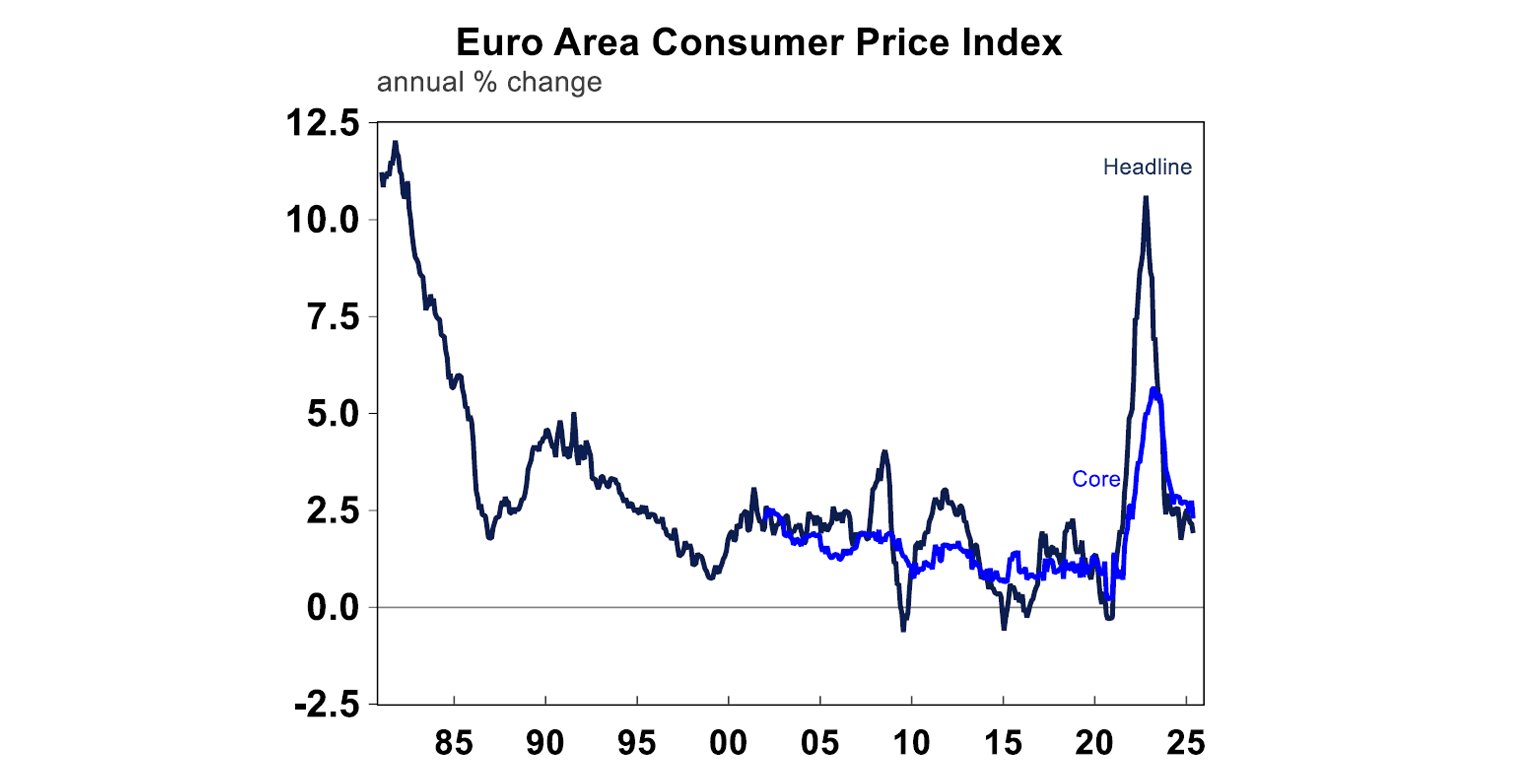
The European consumer price index was flat over May, an annual growth slowed to 1.9%. Core CPI was up by 2.3% over the year to May.
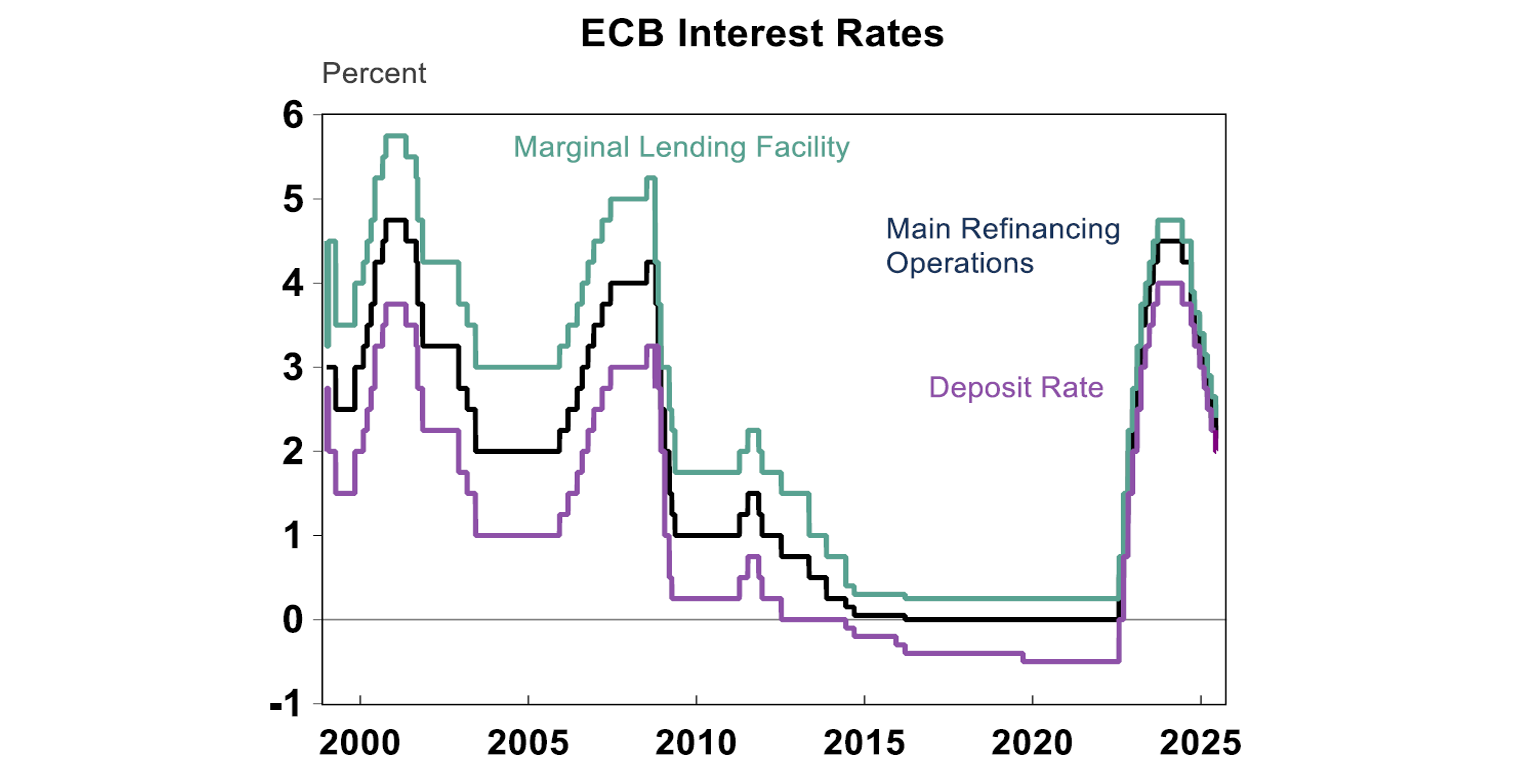
The low inflation backdrop was a reason behind the ECB’s decision to cut the deposit rate by another 0.25% this week. The ECB revised down its near-term growth forecast (due to trade uncertainty) but expect stronger growth in 2026.
Inflation forecasts remain around 2%. ECB President Lagarde said that the ECB is “getting to the end of the monetary policy cycle”. There could be one more rate cut in July or September but it’s hard to see more after that. The ECB has already cut rates by 2% in this cutting cycle.
The Bank of Canada kept interest rates unchanged at 2.75% after having already cut rates by 2.25%. But, the central bank had a dovish tone, with a cut expected at the next meeting.
Australian economic events and implications
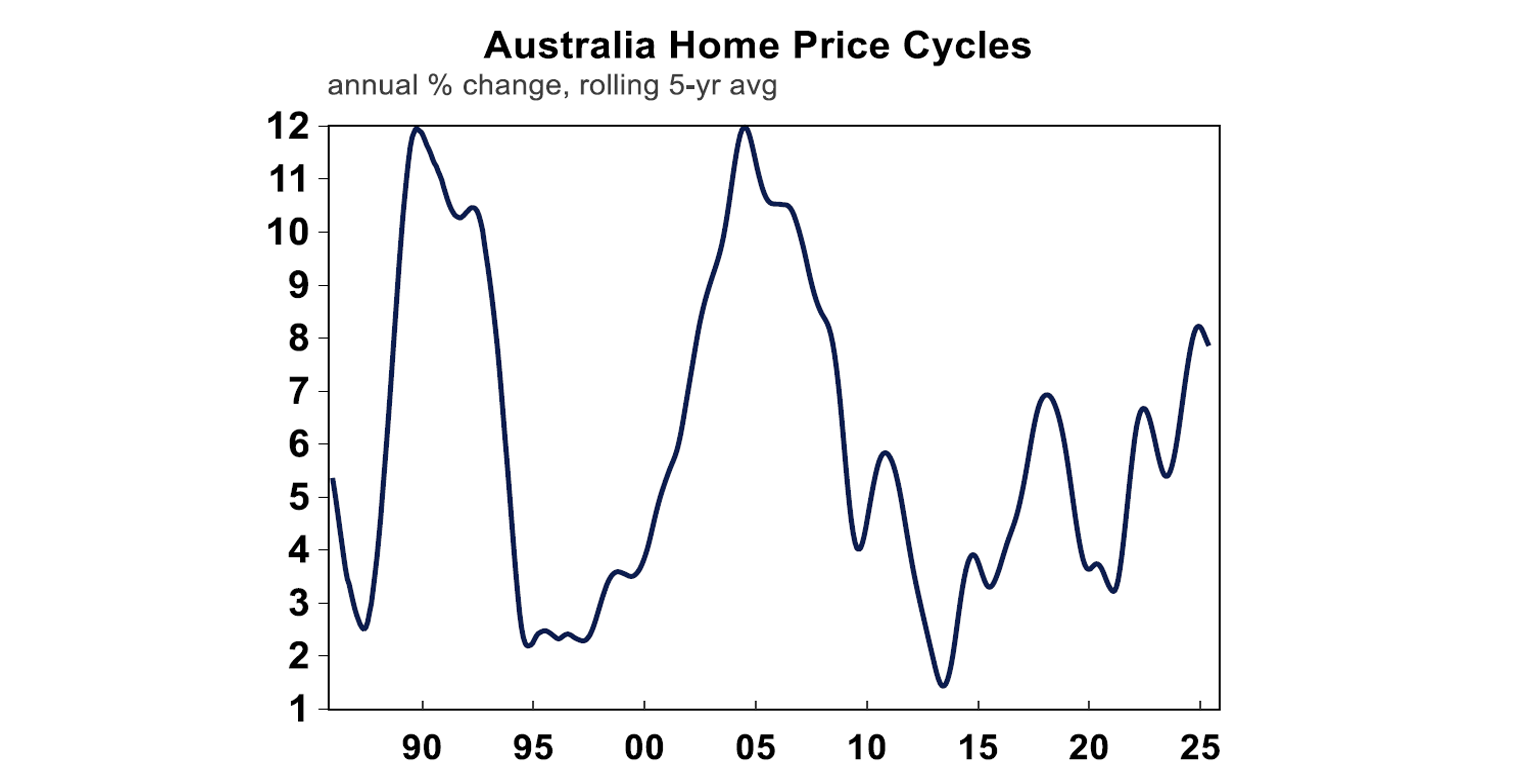
Australian home prices rose by 0.5% in May, according to data from Cotality and annual growth rose to 3.3% with the national median home value at a new record high of $831,288. The housing markets has been given a boost from the RBA cutting rates. While there are differences in conditions across the capital cities, we now expect home prices to rise by around 5 or 6% this year (our prior expectation was for a 3% lift). The resilience of the housing market in the rate hiking cycle has been astounding.
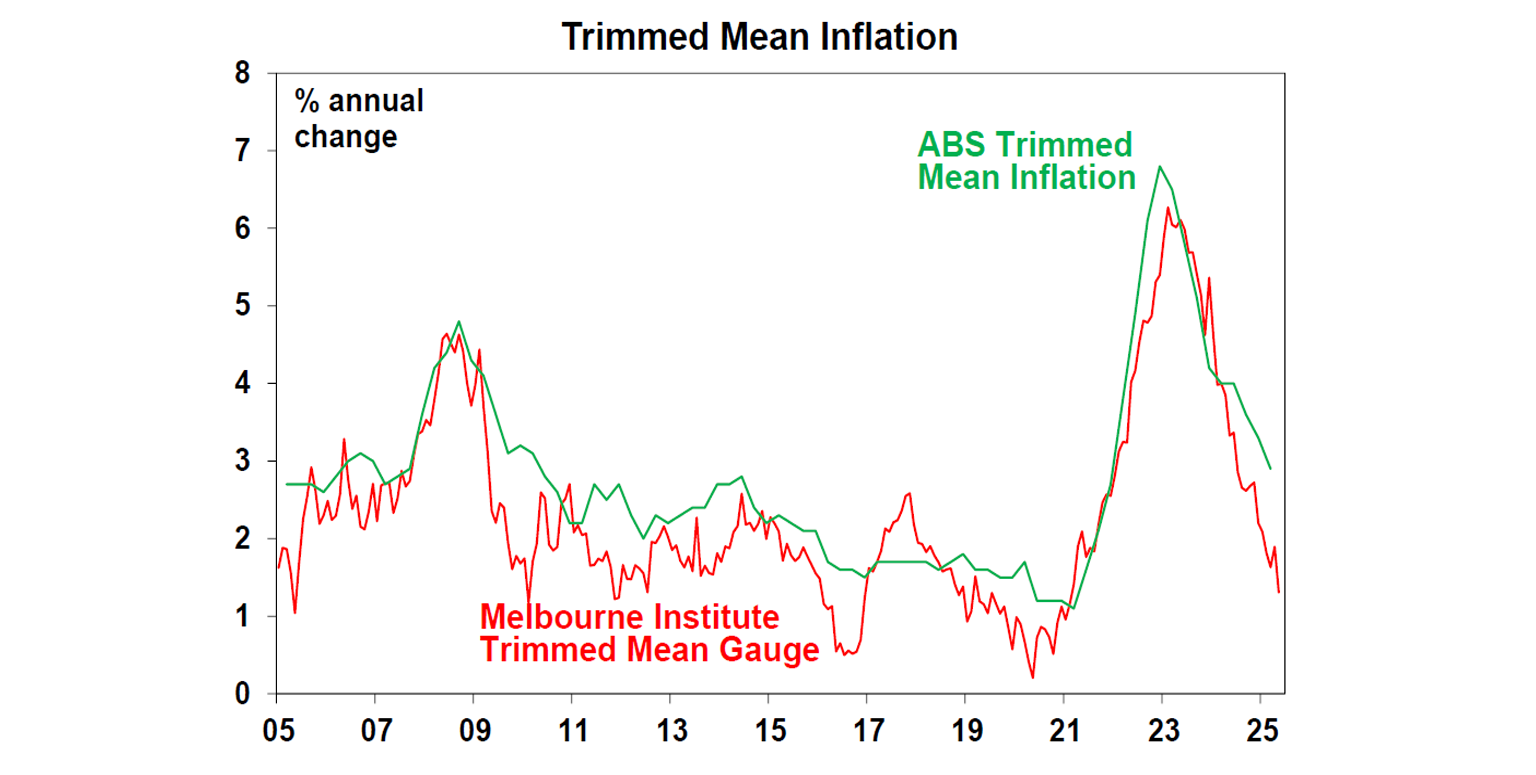
The Melbourne Institute inflation expectations index fell by 0.4% in May and was 2.6% higher over the year, down from 3.3% last year. The trimmed mean index also fell further, signalling more downside to inflation. This index doesn’t match up exactly with the official inflation data from the ABS, but it gives a good general trend.
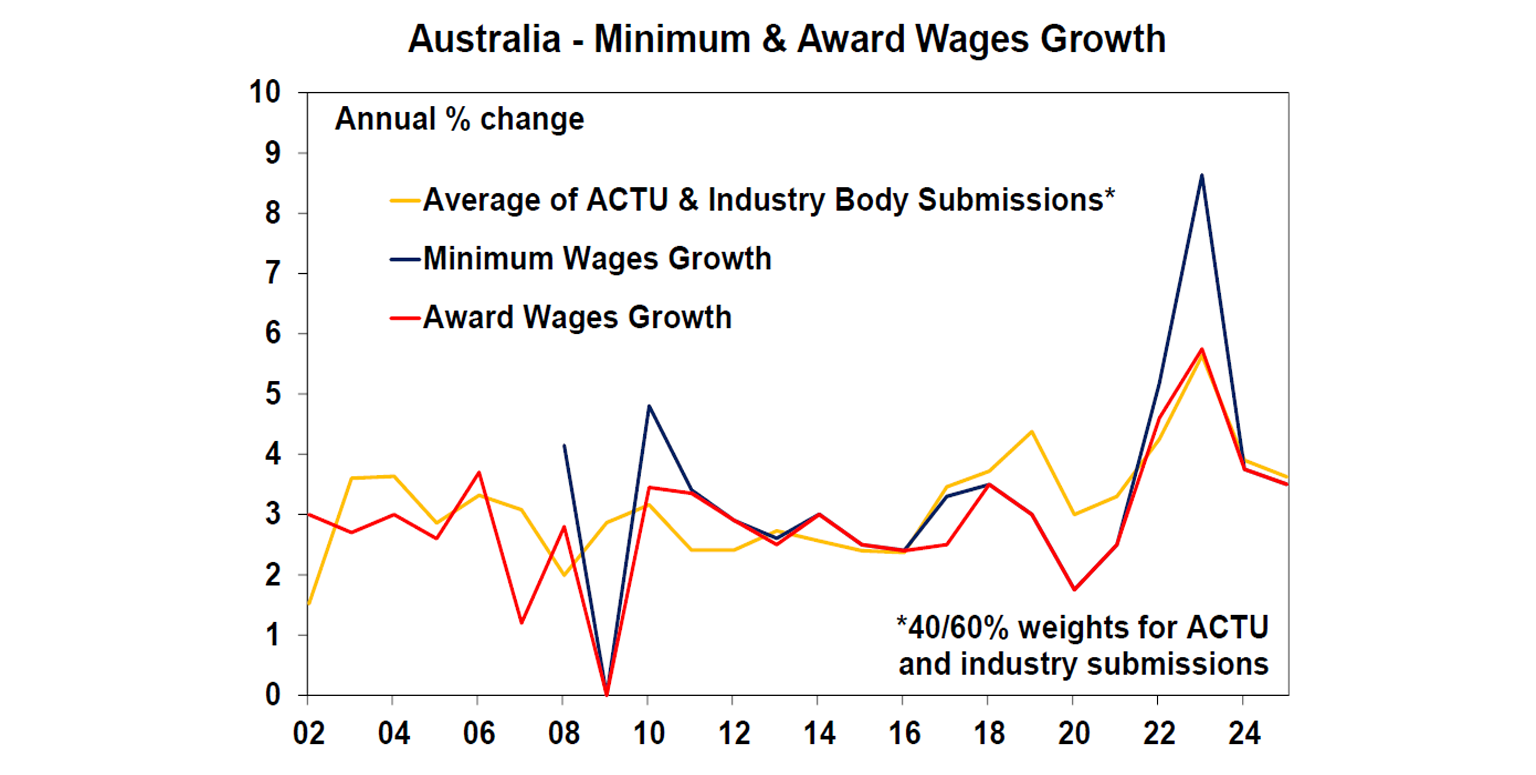
The Fair Work Commission awarded a 3.5% increase to minimum wages and award rates. This impacts just over 21% of the work force but because a lot of these roles are part-time and at lower pay, they make up a lower amount of the wages bill, at 10.5%. There can also be a flow-through to Enterprise Bargaining Agreements and even private sector agreements as individuals often look to the decisions by the Fair Work Commission as guide for their own wage expectation. This years increase is higher than the pace of inflation (at 2.4% over the year to June) but lower compared to last years rise of 3.75%. But there is also some flow through to Enterprise Bargaining Agreements and potentially private sector agreements. The industries that are most impacted are those in accommodation and food services, health care and social assistance, retail trade, administrative and support services – they account for over two-thirds of all modern award employees. The Fair Work Commission decision does not threaten the near-term inflation outlook. We expect wages growth to slow from its current pace of ~3.4% to 3% by the end of the year. But there is the concern that due to low productivity growth,that unit labour cost for business (which includes a productivity component) will remain too high which could be inflationary in the long-run.
The most interesting part of the RBA May meeting minutes (when the Board cut the cash rate by 0.25% to 3.85%) was the discussion about whether the central banks should reduce the cash rate by 0.25% or 0.5% at that meeting.
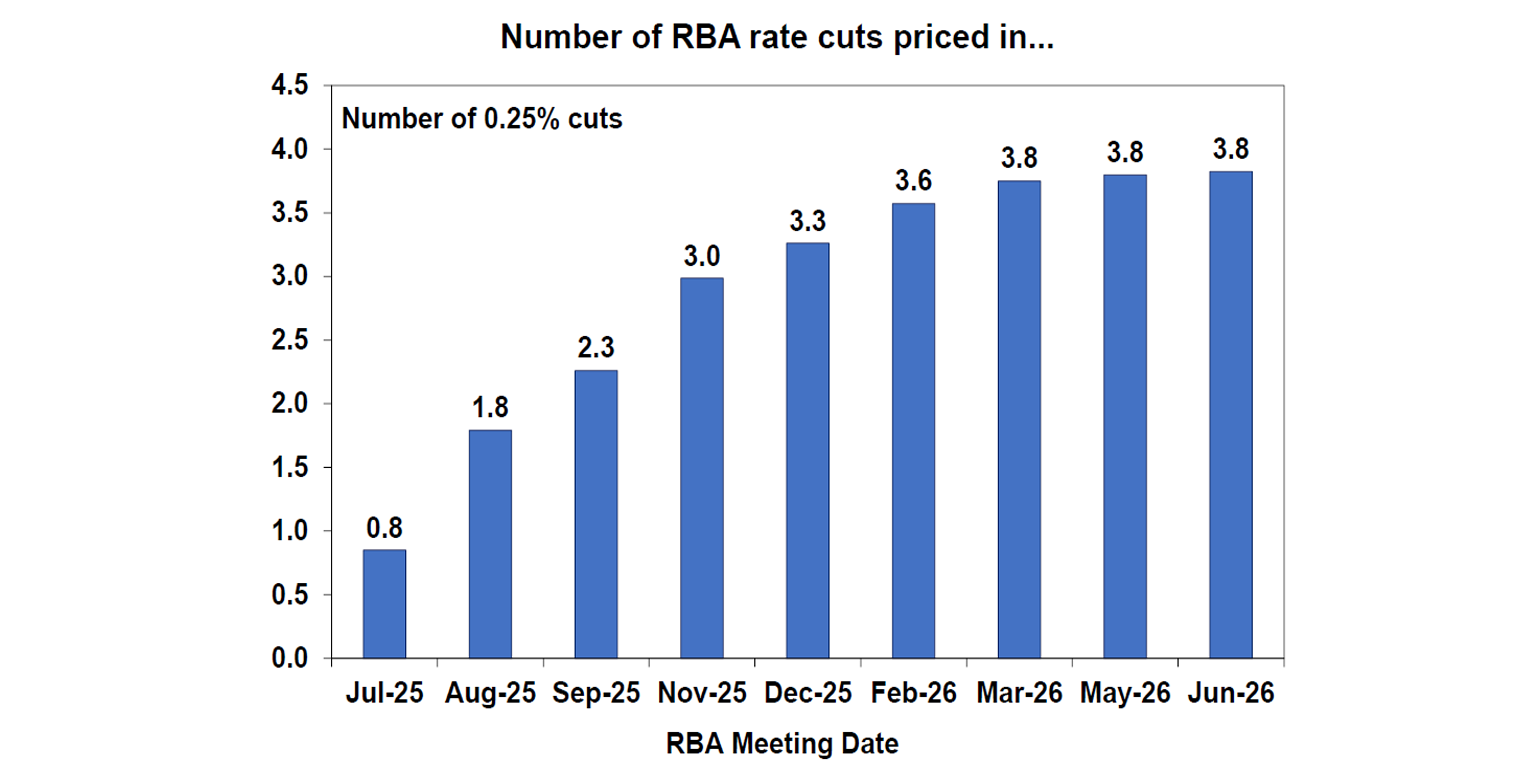
Ultimately, Board members decided that a 50 basis point rate cut was too large given that the domestic data was holding up. The minutes also implied that the RBA sees current interest rates as being around neutral. The weakness in this week’s March quarter GDP data pushed us to now expect another 0.25% rate cut in July (as well as August, November and February 2026). This is similar to market pricing at the moment.
Australia’s March quarter GDP data showed that in the first 3 months of 2025, economic growth was very low, because of the continuing impacts of high interest rates on the economy, as well as poor weather disrupting production and exports. It is too soon to see the impacts of US tariffs on Australian exports in this set of data. March quarter GDP rose by 0.2% over the quarter, or 1.3% over the year which was below economist consensus forecasts of a 0.4% increase (we were expecting 0.3%). But the pace of annual GDP growth is slowly increasing after bottoming at 0.8% (year on year) in September 2024.
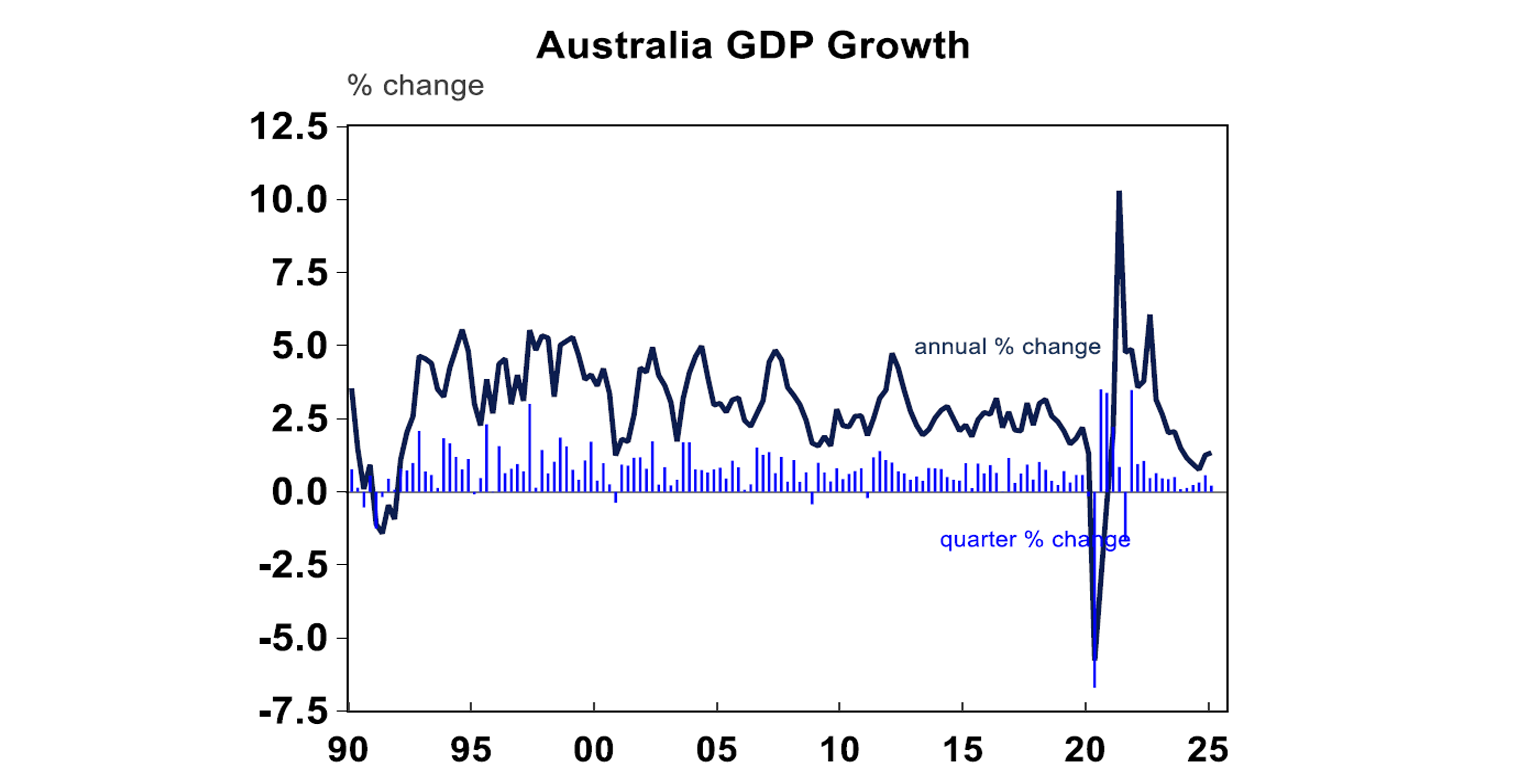
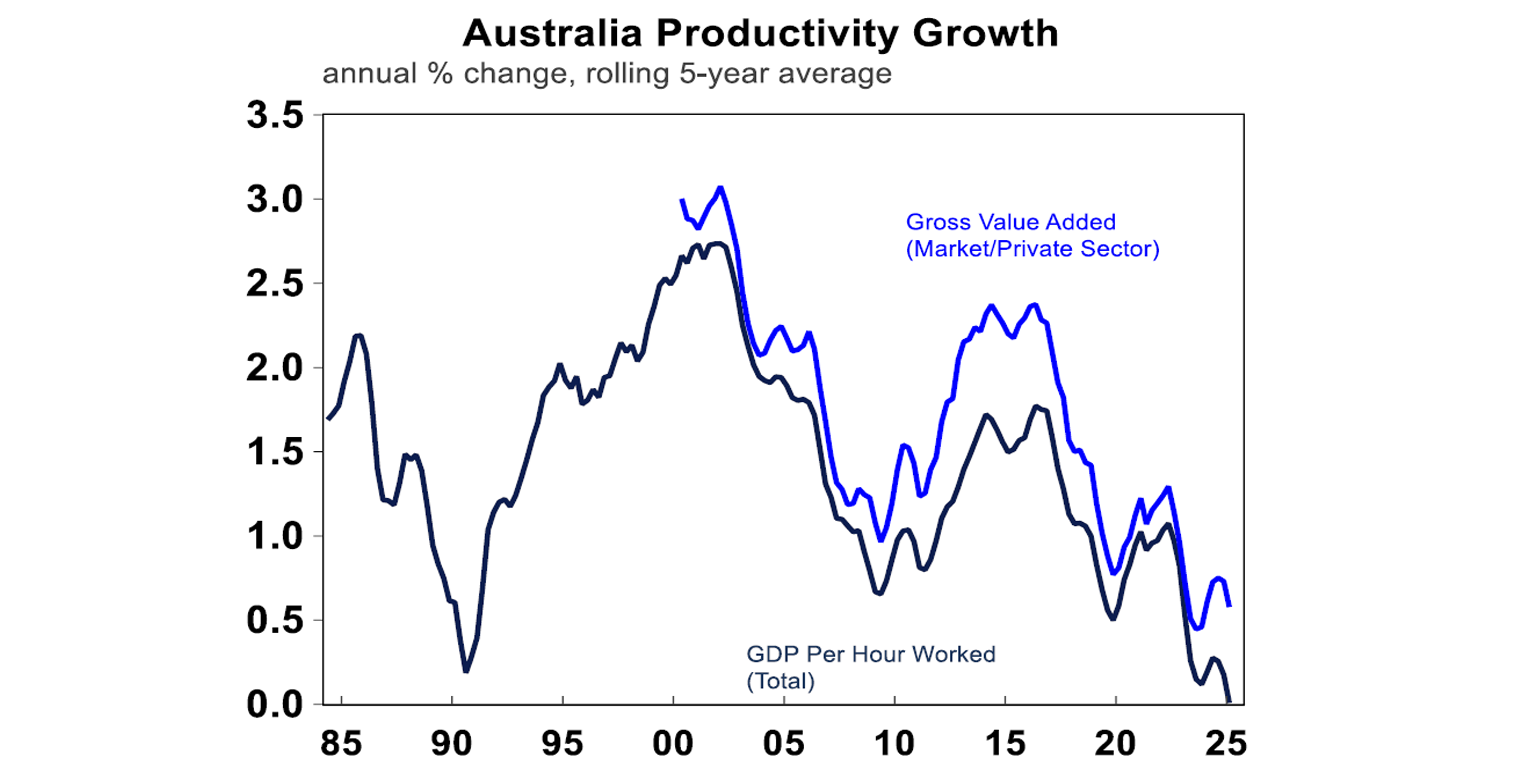
But it was concerning to see a fall in per capita GDP again (it has fallen in the last 9 out of 11 quarters, the longest decline in per capita GDP on record) which is bad for living standards. And, productivity growth looks shocking. It was flat over the quarter again, down by 0.9% over the year and the 5-year rolling average is flat. This is well below historical and more normal elves of 1-1.5% per year. Rising productivity is what matters for long-run wages growth and living standards.
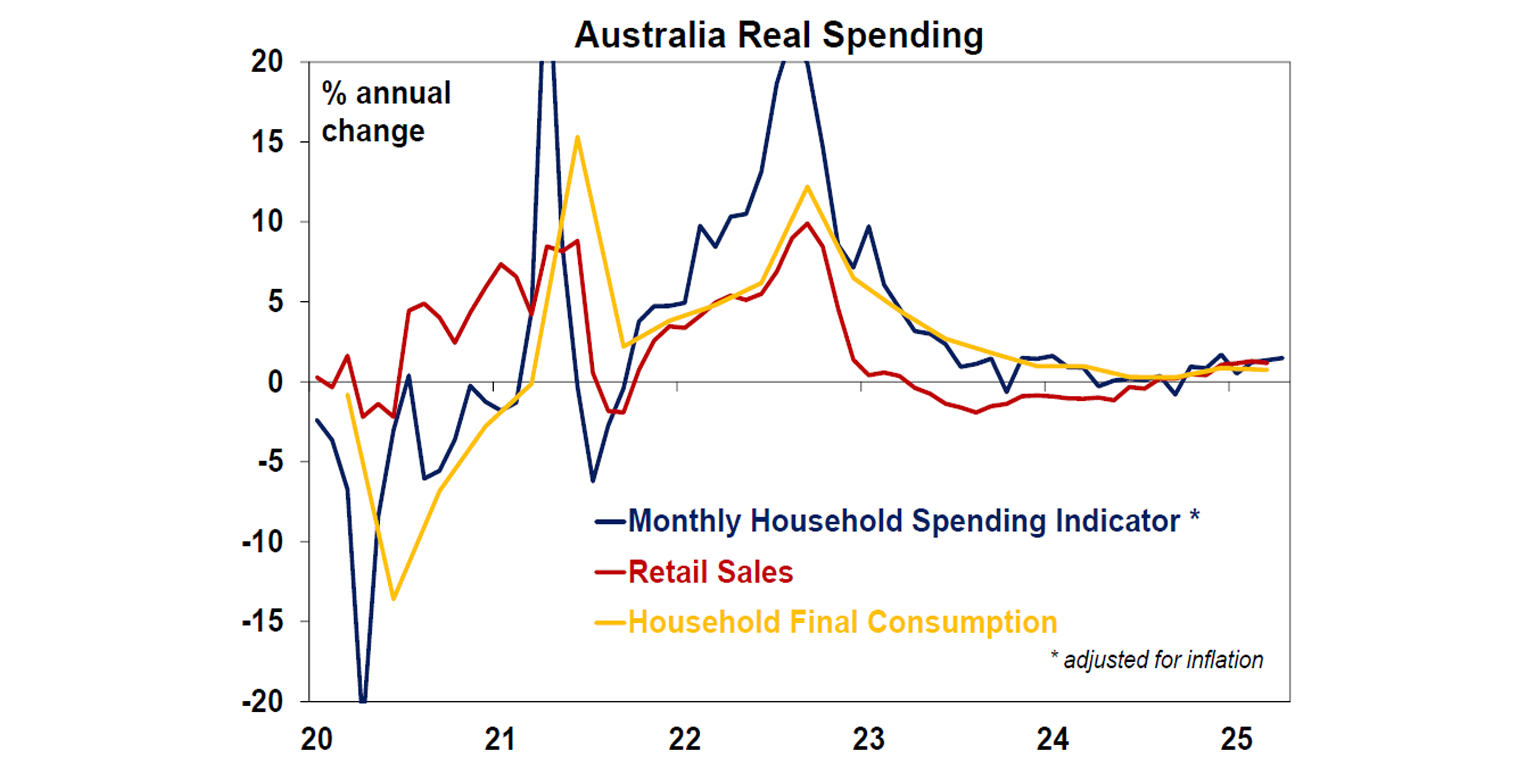
The monthly household spending indicator rose by 0.1% in April (slightly below forecasts of a 0.2% rise) and annual growth lifted to 3.7%. Consumer spending has recovered from its 2024 lows, but is still poor and has flat-lined in recent months (see the chart below).
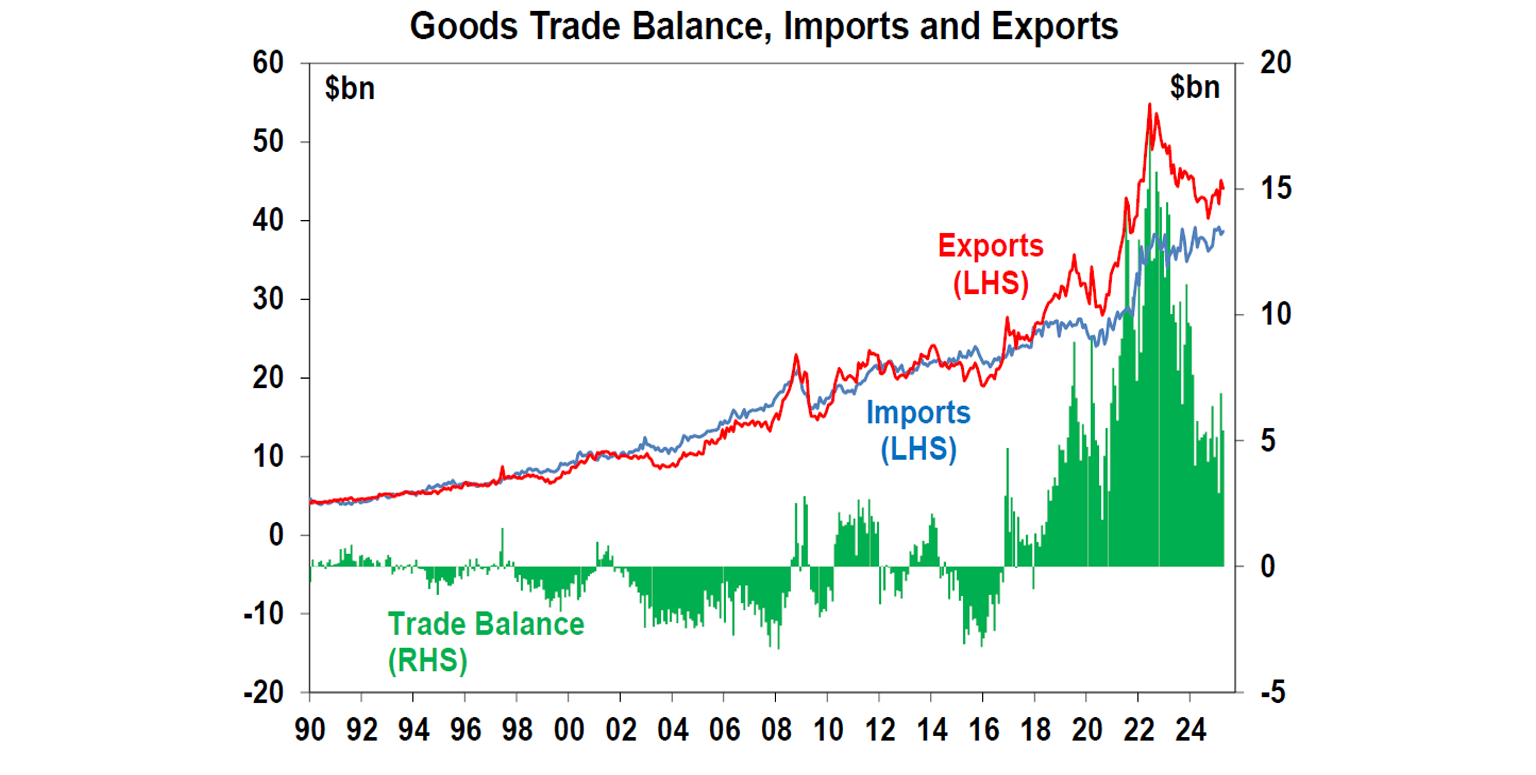
The April trade balance narrowed to $5.4bn (from $6.9bn last month) with exports declining by 2.4% over the month (with a decline in non-monetary gold exports after an unusually large increase last month) and imports increasing by 1.1%. Australia’s trade surplus remains high (see the chart below) which means that we are exporting more to the world than we are importing which is good from a national income point of view.
What to watch over the next week?
US May CPI data is expected to show a 0.2% lift over the month, or 2.5% over the year with core CPI at 2.9% (from 2.8% last month). Producer price indices for May are also released, expected to rise by 0.2% after a fall last month. Both releases will be dissected to look at any tariff impacts on specific goods. The monthly University of Michigan consumer sentient indicator will also update consumer expectations on short and medium-term inflation which have been rising significantly.
In Australia next week, it’s a much lighter data week, with only the monthly consumer sentiment and business confidence data of note which could get a boost from the RBA’s June rate cut.
And in the rest of the world it’s fairly quite data-wise. Chinese May inflation figures and trade data is out and some monthly German activity indicators are released.
Outlook for investment markets
Shares are at high risk of renewed falls given the ongoing tariff uncertainties, concerns about US debt, likely weaker growth and profits and the risk of a US/Israeli strike on Iran’s nuclear capability if diplomacy doesn’t work. But with Trump likely to pivot towards more market friendly policies and central banks, including the Fed and RBA, likely to cut rates further shares are likely to recover on a more sustained basis into year end. It’s likely to be a rough ride though.
Bonds are likely to provide returns around running yield or a bit more, as growth weakens, and central banks cut rates. A US public debt crisis is the main threat to this.
Unlisted commercial property returns are likely to improve in 2025 as office prices have already had sharp falls in response to the lagged impact of high bond yields and working from home.
Australian home prices have likely started an upswing on the back of lower interest rates. But it’s likely to be modest initially with US tariff worries constraining buyers. We see home prices rising around 3% this year but the risk is now on the upside given the more dovish RBA.
Cash and bank deposits are expected to provide returns of around 4%, but they are likely to slow as the cash rate falls.
The $A is likely to be buffeted between the negative impact of US tariffs and the global trade war and the potential positive of a further fall in the overvalued US dollar. This could leave it weak around $US0.60 in the near term.
Undervaluation should support it on a medium-term view with fair value around $US0.73.
You may also like
-

Oliver's insights - Why have Australian living standards “fallen” and how do we fix it? For the last few years there has been much talk of a “cost-of-living” crisis in Australia and of “falling living standards”. This has flared up again lately with the pickup in inflation resulting in a renewed fall in real wages. -

Weekly market update - 10-07-2026 Ceasefire over but markets are also over the war, Why oil prices can't go too low or too high, Is AI adding to inflation risk or taking it away, and Australia’s wage problem. -

How to protect yourself from phishing and impersonation scams Phishing scams can look like everyday messages – emails, texts or calls. Learn the signs and simple steps to protect your money and personal information.
Important information
While every care has been taken in the preparation of this document, neither National Mutual Funds Management Ltd (ABN 32 006 787 720, AFSL 234652) (NMFM), AMP Limited ABN 49 079 354 519 nor any other member of the AMP Group (AMP) makes any representations or warranties as to the accuracy or completeness of any statement in it including, without limitation, any forecasts.
Past performance is not a reliable indicator of future performance. This document has been prepared for the purpose of providing general information, without taking account of any particular investor’s objectives, financial situation or needs. An investor should, before making any investment decisions, consider the appropriateness of the information in this document, and seek professional advice, having regard to the investor’s objectives, financial situation and needs.
This document is solely for the use of the party to whom it is provided. This document is not intended for distribution or use in any jurisdiction where it would be contrary to applicable laws, regulations or directives and does not constitute a recommendation, offer, solicitation or invitation to invest.