


Weekly market update
Investment markets and key developments
US sharemarkets had a strong week, up 5.3% (Australia rose 1.4%) thanks to the “Dealmaker in Chief” Trump and the de-escalation in the US/China trade hiatus.
12 min read

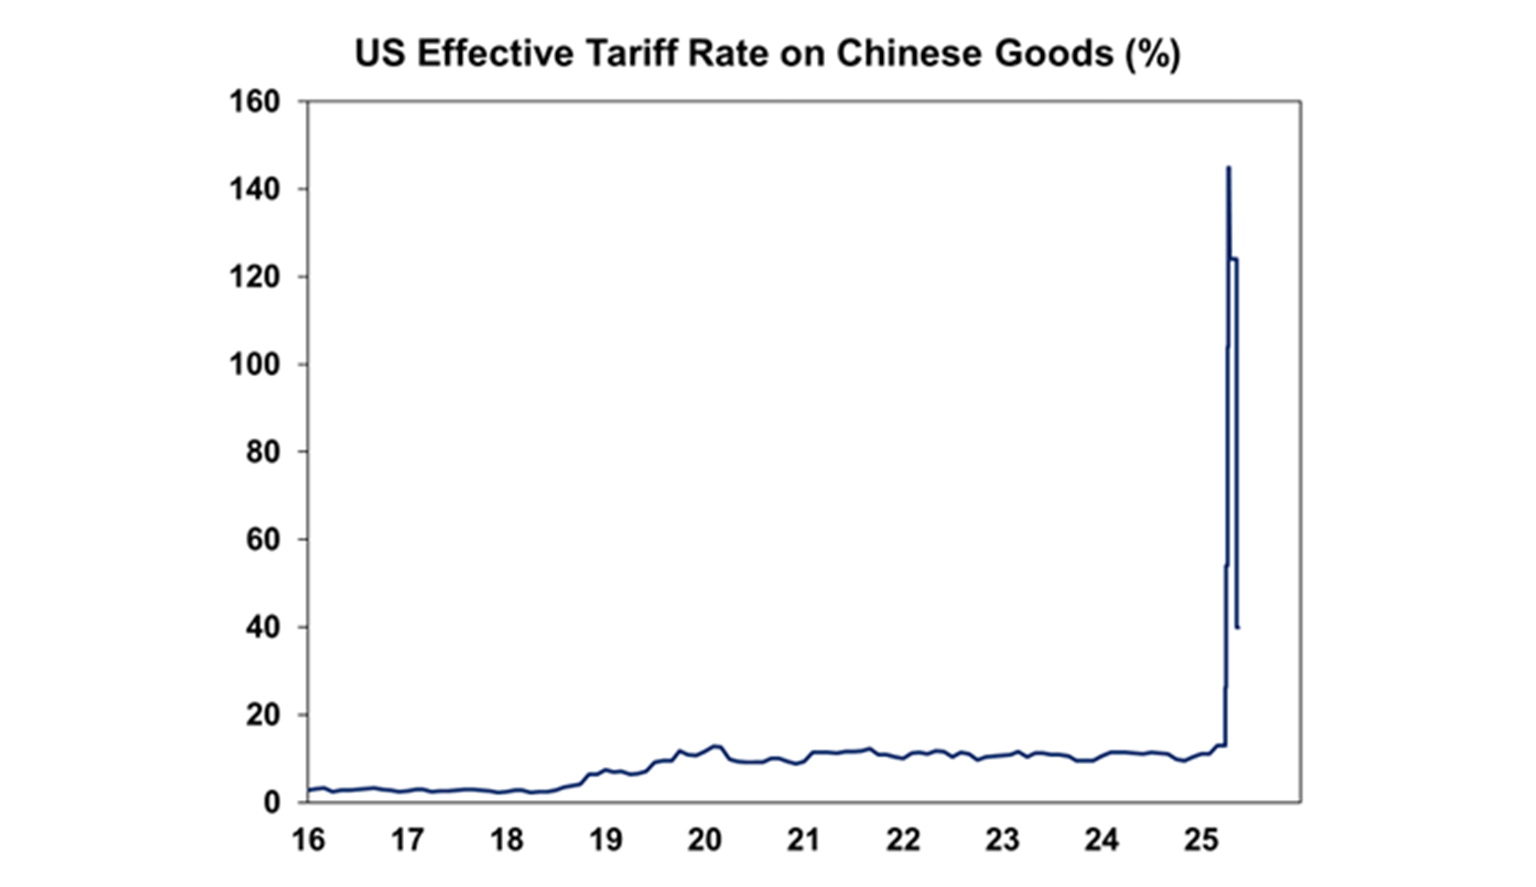
US sharemarkets had a strong week, up 5.3% (Australia rose 1.4%) thanks to the “Dealmaker in Chief” Trump and the de-escalation in the US/China trade hiatus. The US reduced tariffs on Chinese imports to 30% (for a period of 90 days), after lifting them to 145% (see the chart below) post Liberation Day. China will also reduce its tariffs on US imports to 10% (from 125%).
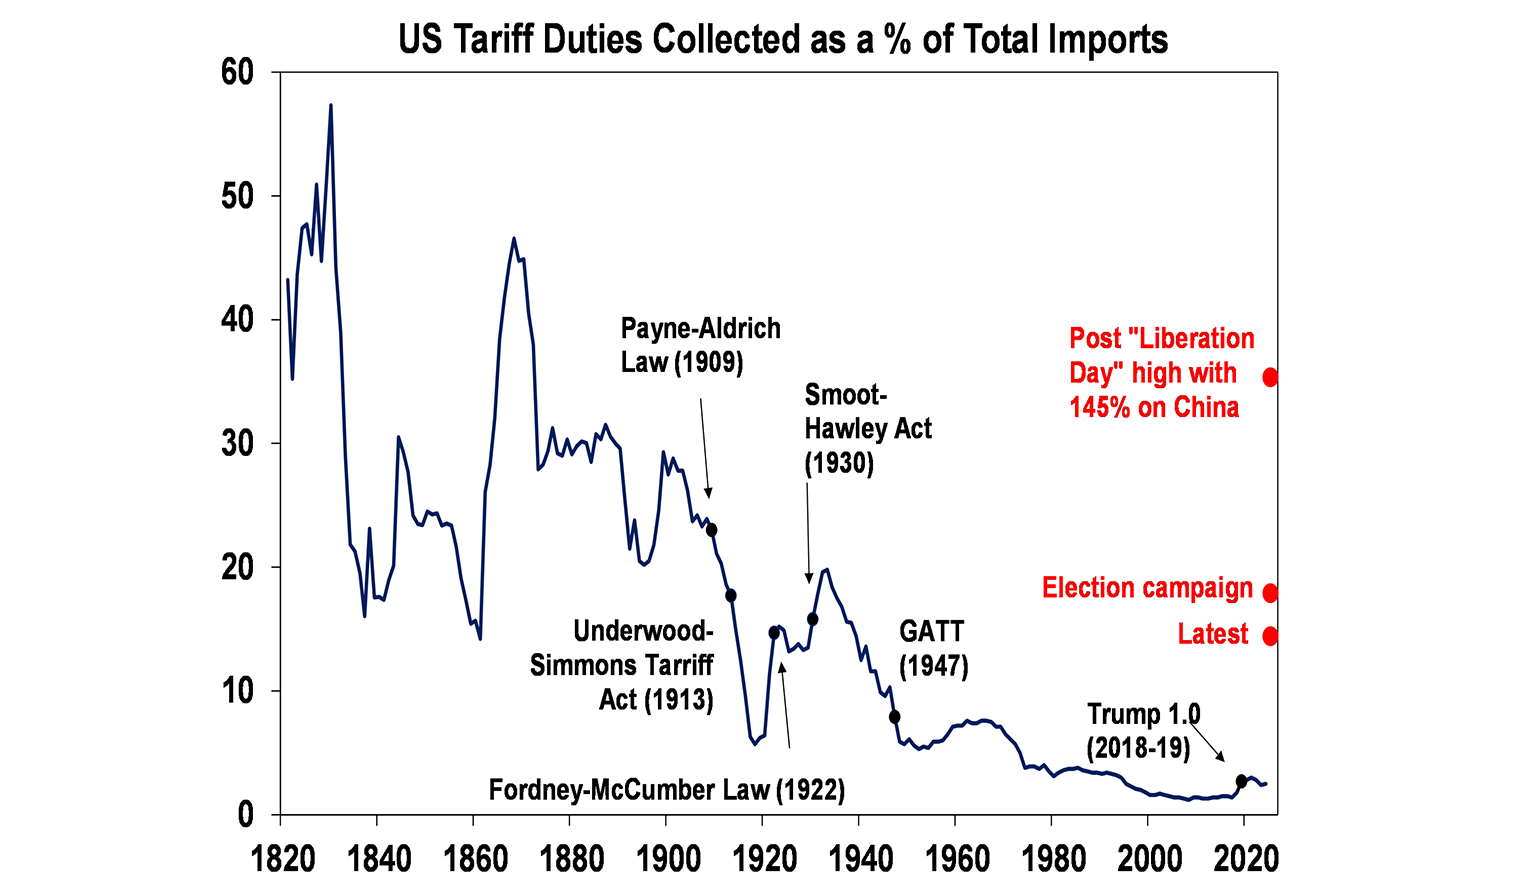
Markets cheered this news, reading it as sign that if Trump can make a deal with China, he can make a deal with anyone. The reduction in tariffs will have a sizeable impact on US tariff rates. Currently, we estimate the average US tariff rate on goods coming into the US to have been ~25% but will now decline to ~14% (based on the latest trade deal with China, the 10% reciprocal baseline tariff on all global trading partners, sector-specific tariffs on steel & aluminium and cars and car parts, some relaxation on Canada and Mexico and exempting items like computers and smartphones). While a 14% average tariff rate is still at the highest levels the US has had since the 1940’s, it’s well below post-Liberation Day highs of +30% (and below levels implied during Trump’s campaign rhetoric) – see the next chart.
A timeline was very helpful for me when putting this all together as it gets so confusing.
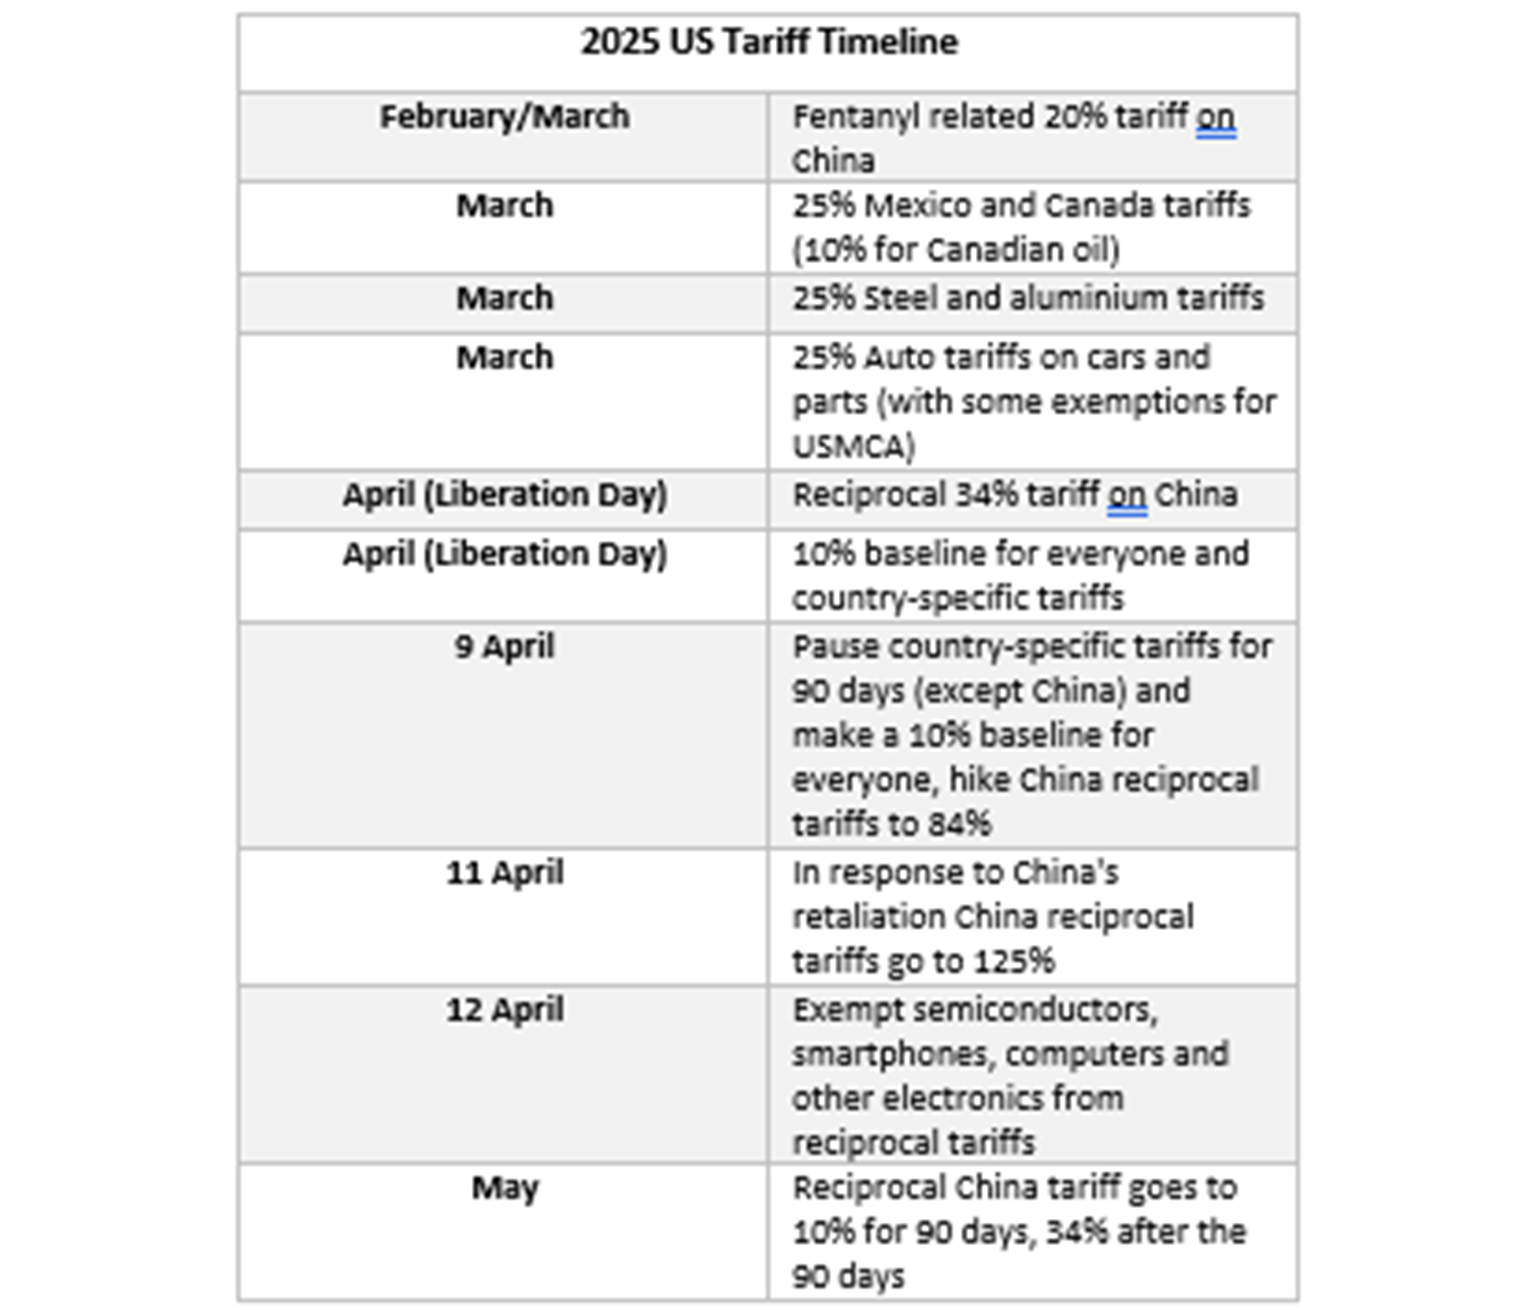
The trade deal with China indicates that other trade deals are likely to be announced before the end of the 90 days (due in early July). There also seemed to be talk around progress in removing the 20% fentanyl tariffs on China, which would reduce the average tariff rate on China even further. The trade deal also indicates that Trump is still sensitive to short-term sharemarket volatility, large falls in shares (and associated recession risks) and a rise in US bond yields. It also seems a bit wild to me that Trump is still coming out with sharemarket “tips” on his social accounts.
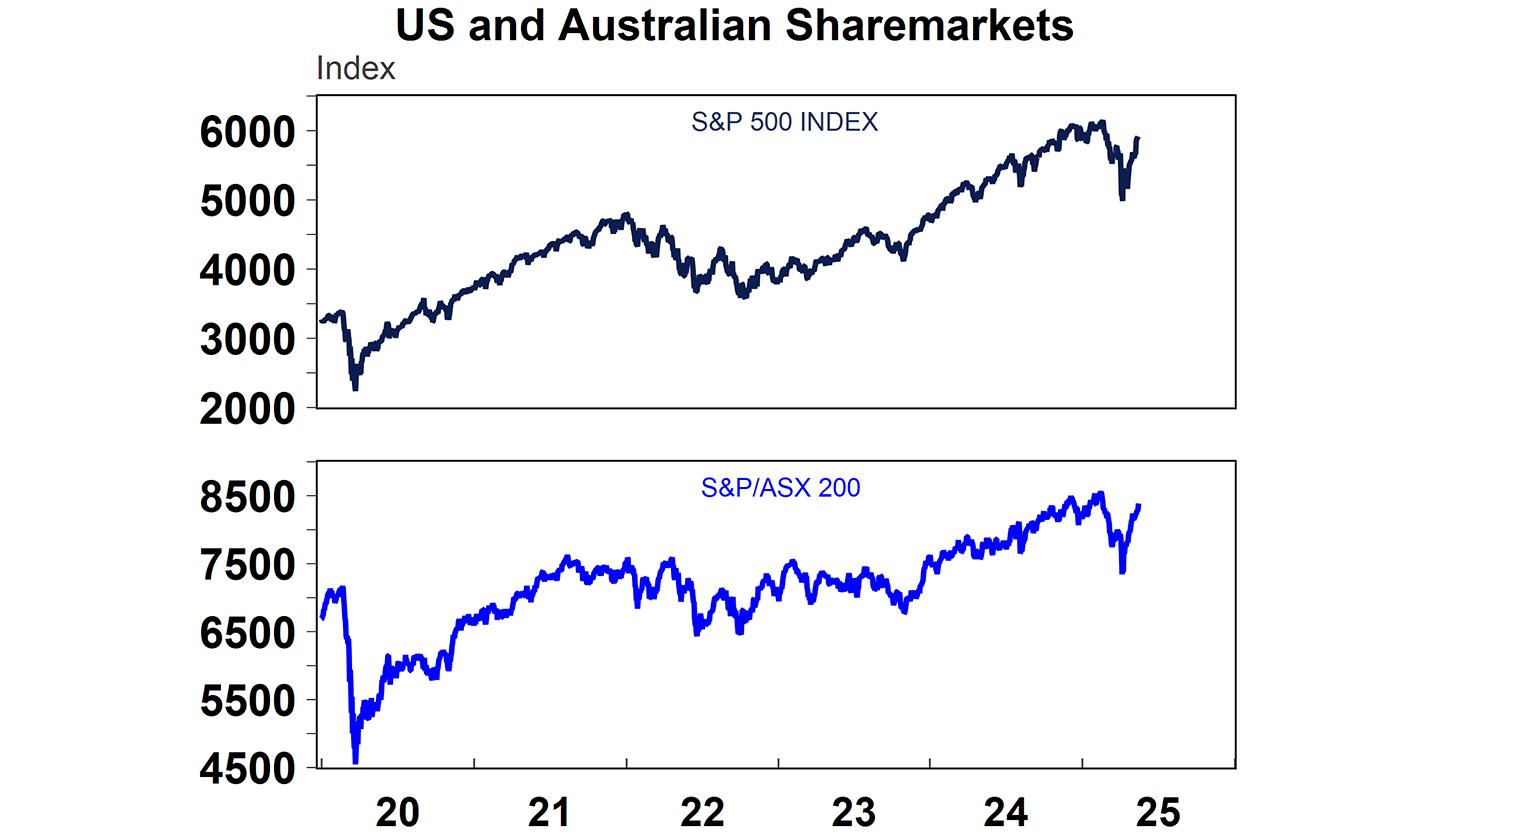
As a result of all of this good news, it makes sense that US shares have now recovered all of their post Liberation day falls. US shares are up by 19% from their bottom and are only 4% below their all-time highs. In Australia, shares never fell as much as the US and are up by 14% from their lows, and are only 2% below all time highs.
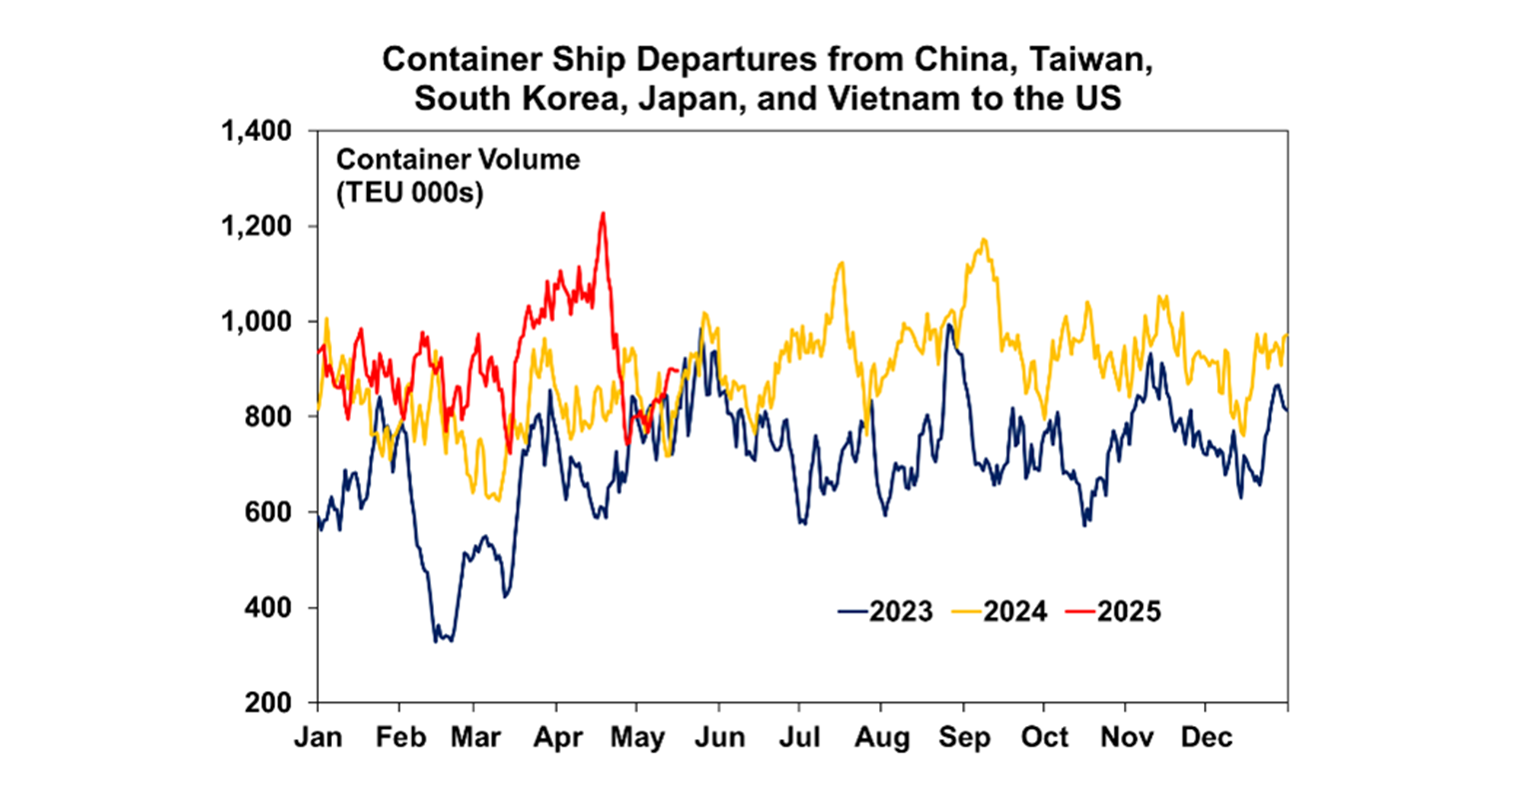
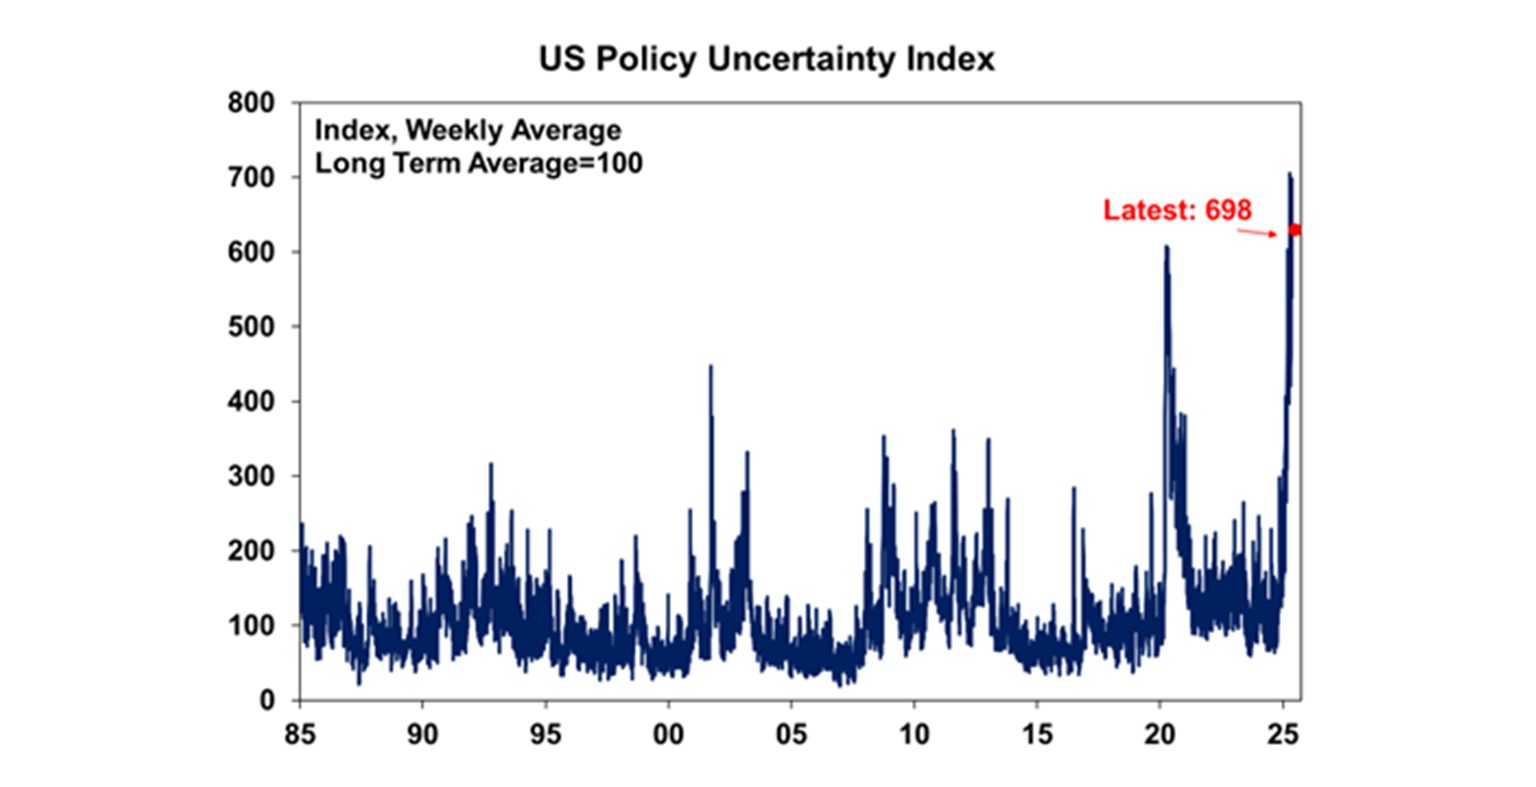
While news of more trade deals before the 90 days is up could boost shares further from here, as it may appear like the worst is behind is, the risk is that trade issues could flare up again after the 90 day pause ends. US policy uncertainty is still around an all time high (see the chart below) even though it reduced slightly this week. Uncertainty is not good for investors, business or consumers. The latest data on container ship departures from South East Asisa to the US have actually picked up again (see the chart below) and in line with recent historic levels. There was a big rise in container departures in April, as businesses were trying to front-load tariff impacts so naturally there was also a decline after this big rise. So, it looks like global trade growth is still holding up.
There is also the risk that US economic hard data will start to deteriorate from here, from the impacts of higher costs, uncertainty, DOGE job cuts and lower labour supply from reduced immigration. So, sharemarkets may not get back to their recent lows, but further falls in the short-term are still a possibility.
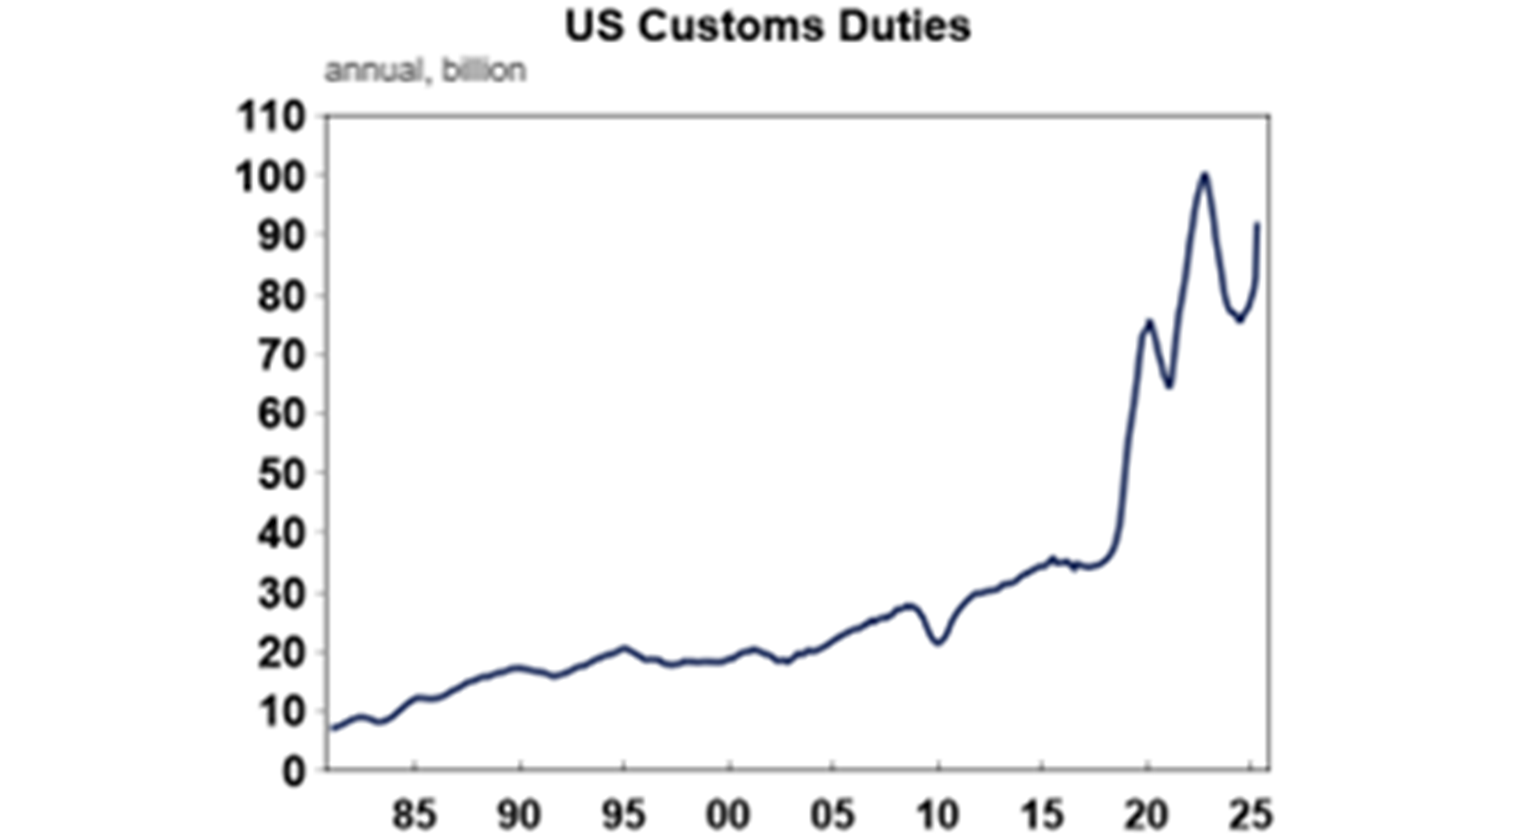
More progress this week on the “one big beautiful bill” with the US House of Representatives advancing to pass the Tax Cuts and Jobs Act reconciliation bill. Details of the bill include an extension of the 2017 tax cuts (due to expire at the end of the year), raising State and Local tax deduction, ending taxes on tips and overtime pay, a higher child tax credit, an estate tax exemption, a small business deduction and partially paid for by rolling back tax breaks for electric cars and clean energy production. The 10-year price tag of the bill is ~$3.8tn which will not be covered by tariff revenue (it’s too early to see the full impact of tariff impact on customs revenue but up to April annual customs duty was running at $92bn on an annual basis – see the next chart) or DOGE savings (approximately $170bn so far apparently although this may be exaggerated).
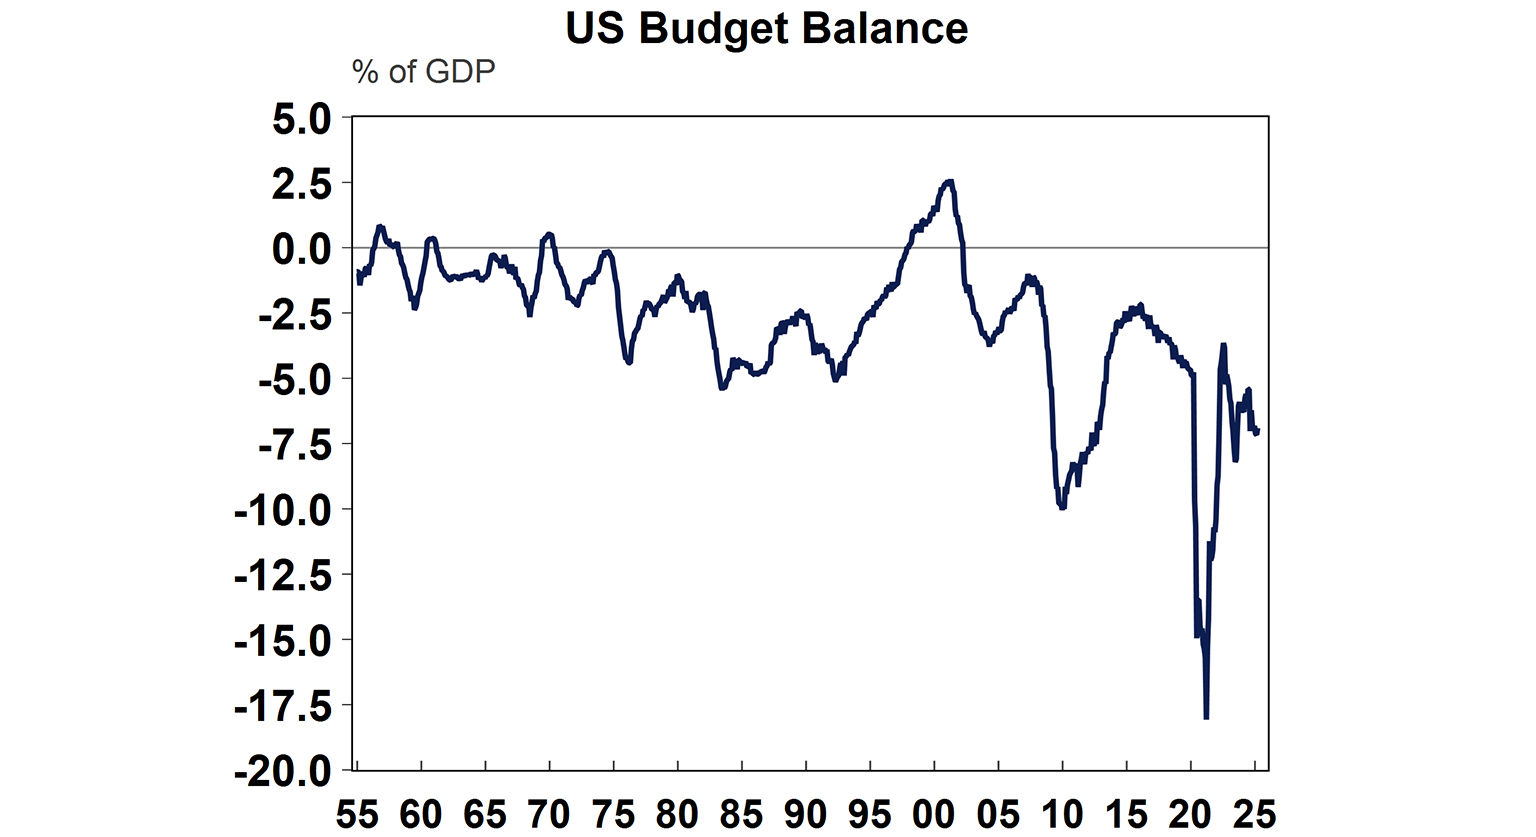
The US budget is already constrained (see the chart below) with the budget deficit at 7% of GDP, so passing tax packages that add to the deficit will be difficult.
This is why in after hours news, Moody’s lowered the US credit score to Aa1, from Aaa. While this will put upward pressure on bond yields and is likely to weigh on shares at the start of the week (with post-market trading indices down), this is the same rating given by Fitch Ratings and S&P Global Ratings so from that point of view it’s not really new news.
Our Chief Economist Shane Oliver wrote a great note this week about the good and bad aspects of Trump’s polices which you can find here. While some are taking the view that Trump’s policies will mean a long-term rotation out of US assets, as Shane so nicely put it, it’s probably premature to revise down long-term sharemarket assumptions based on the first four months of Trump 2.0.
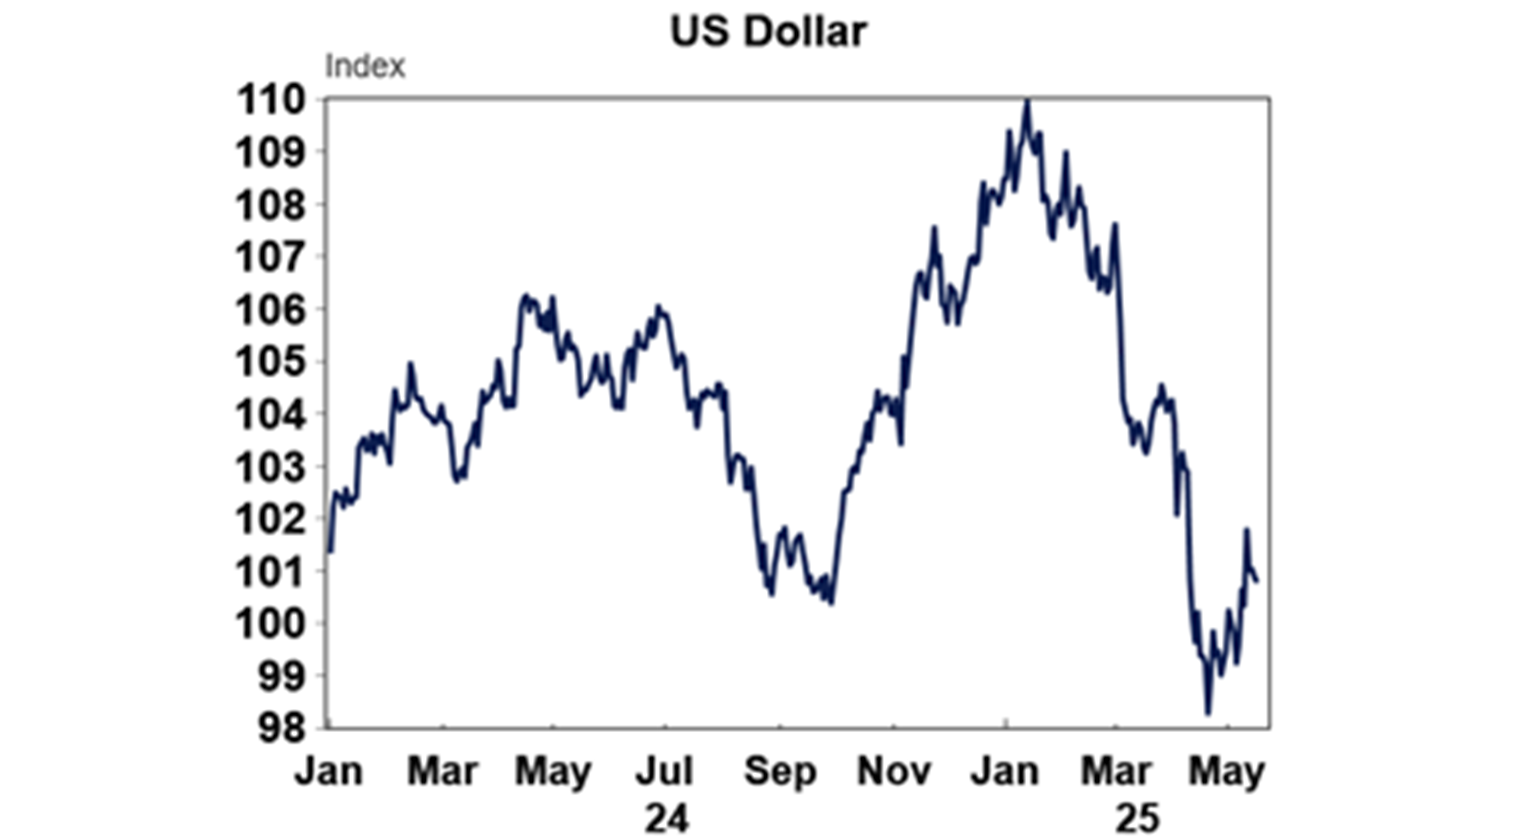
The US dollar has been rising from its post-Liberation day low, but is still well down from its early year highs. This will help US exporters, but is inflationary.
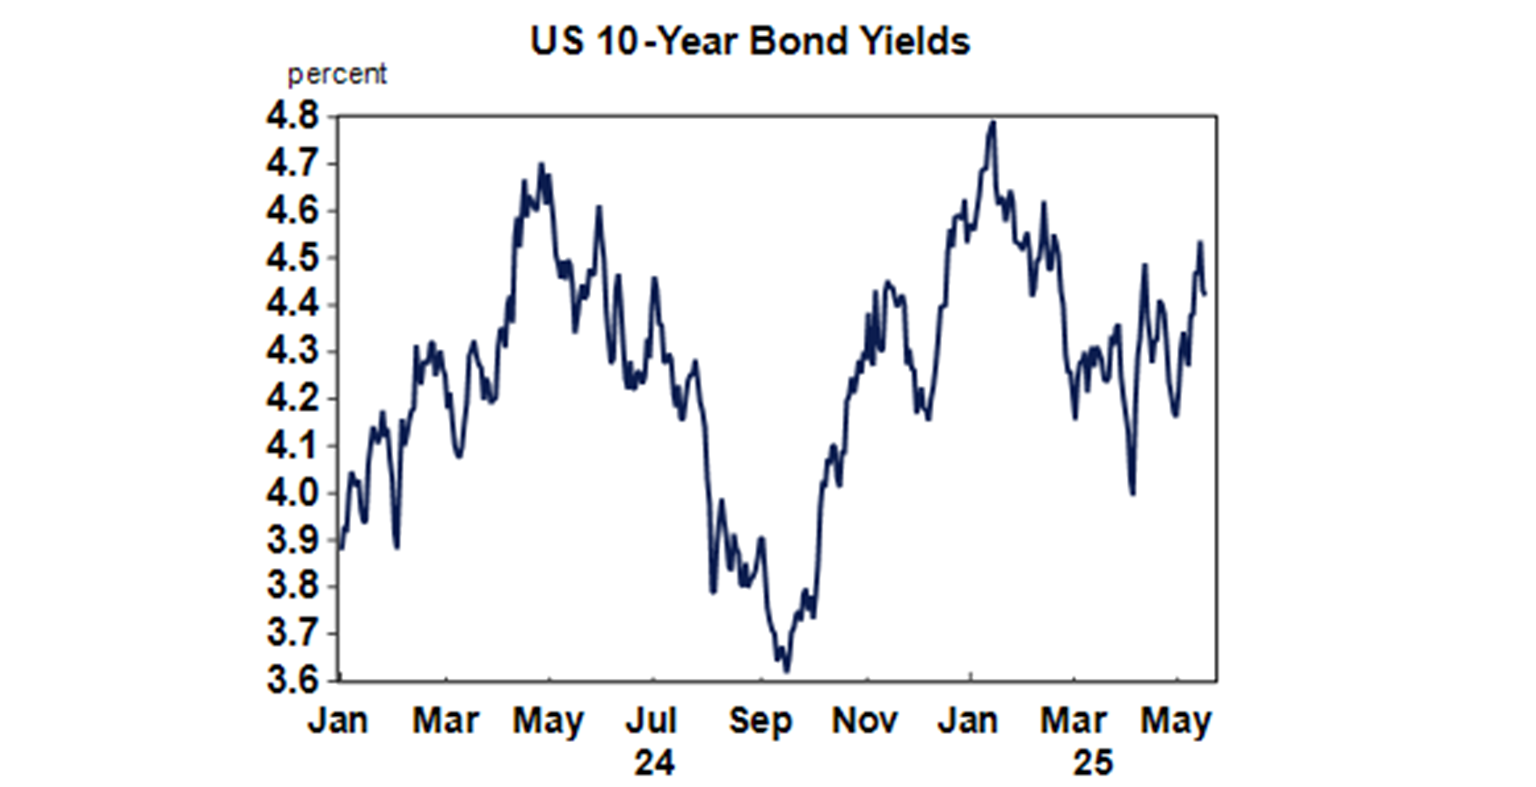
And US bond yields remain elevated around 4.5% for the 10-year, as recession expectations have reduced after the latest trade deal and investors have pared back expectations for Fed rate cuts.
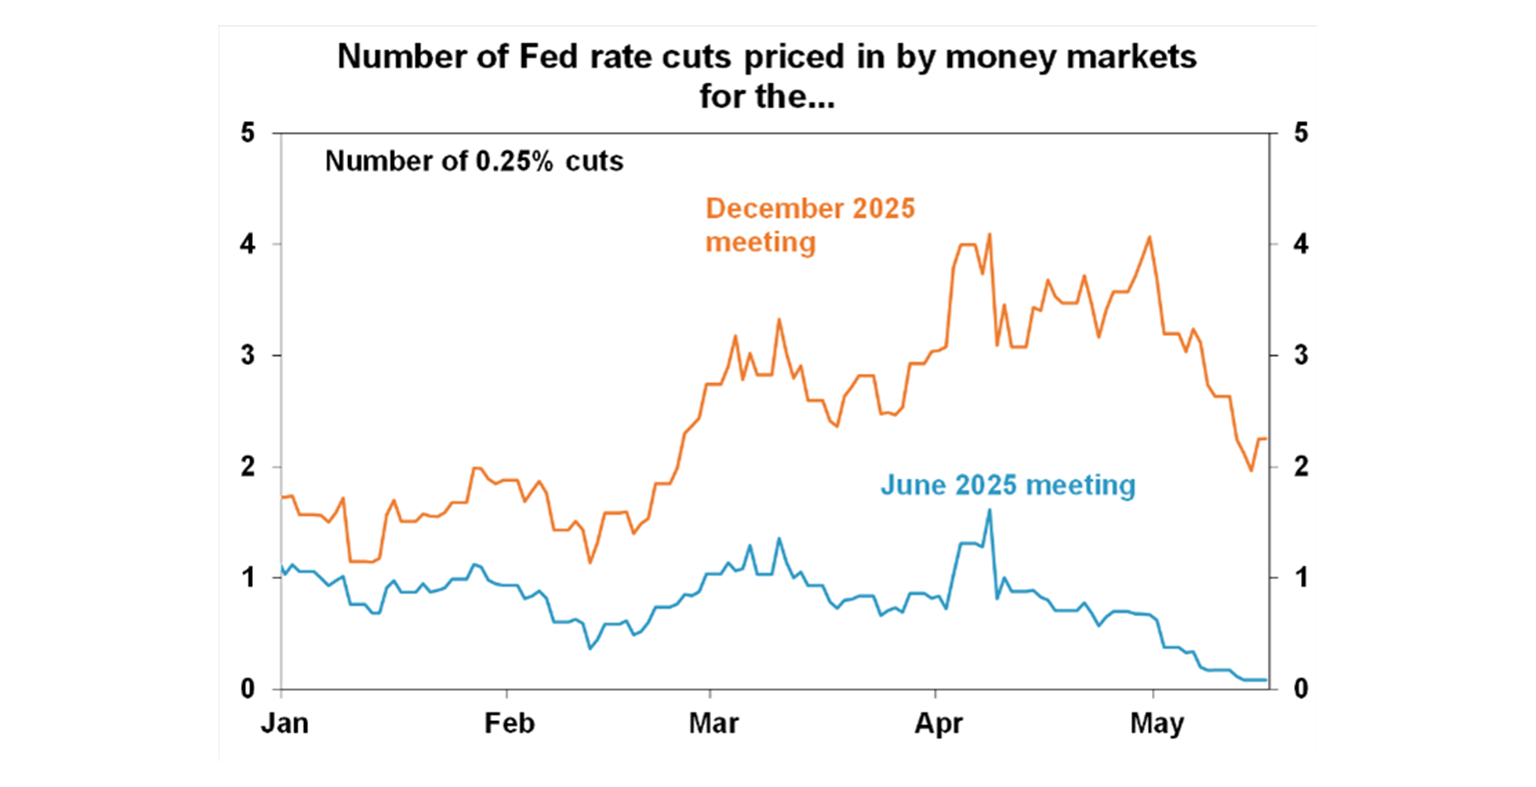
The US Federal Reserve has already cut interest rates by 100 basis points and markets at one stage were pricing in 4 more rate cuts by the end of the year (so another 100 basis points). This was at the peak of US trade policy uncertainty (see the chart below). This was an overaction to the potential negative growth risks. After the good news this week, traders pared back expectations to 2 more rate cuts (worth 50 basis points) this year, which is reasonable and in line with our own expectation. The first cut is likely in July or September which will probably annoy Trump who called US Fed Chair “Too Late Powell”.
Major global economic events and implications
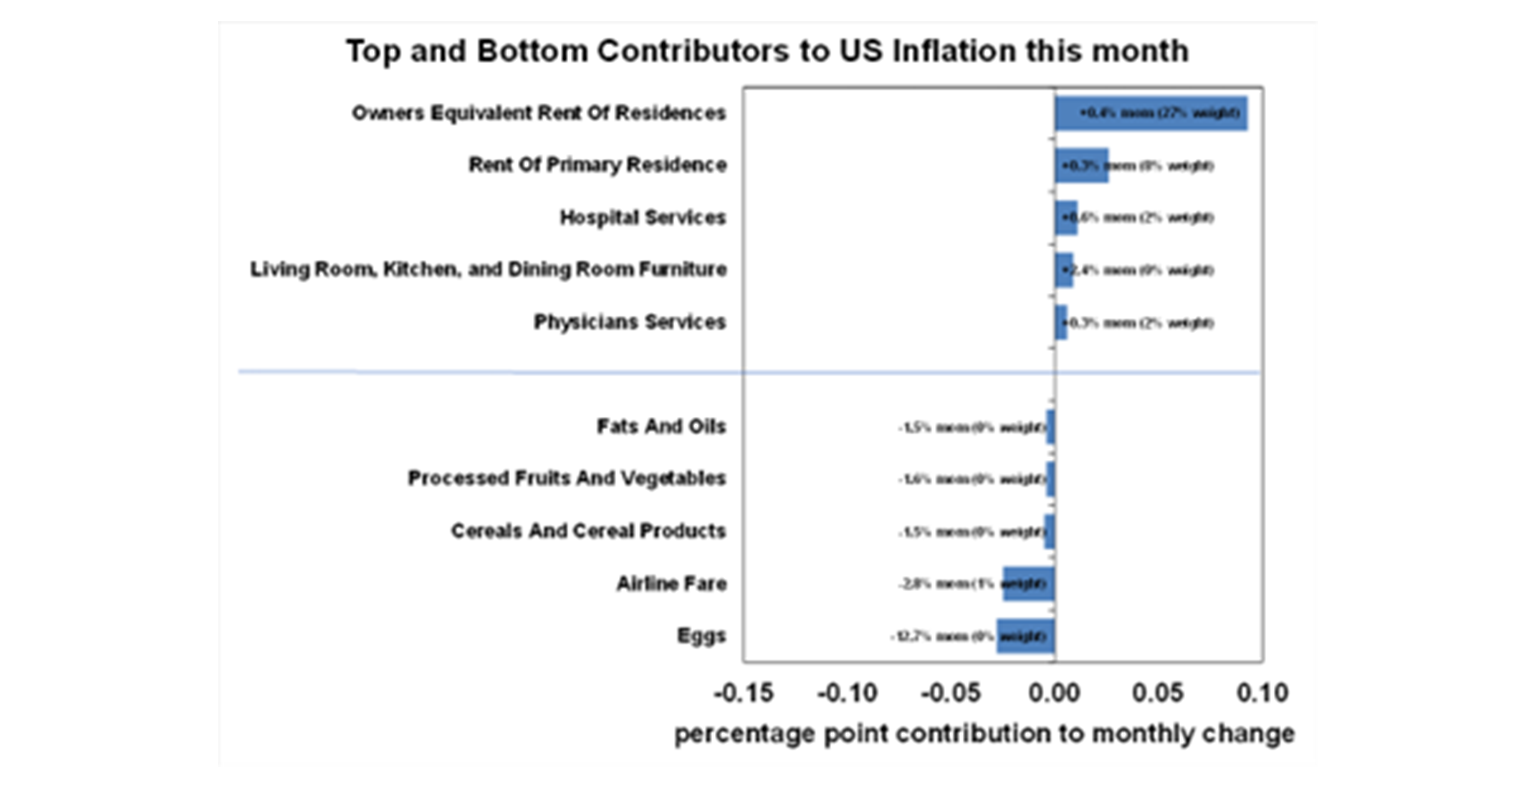
US April consumer prices and came in slightly softer than expected, with headline up 0.2% over the month (0.3% expected) and 2.3% over the year. Core CPI is 2.8% higher over the year (see the chart below).
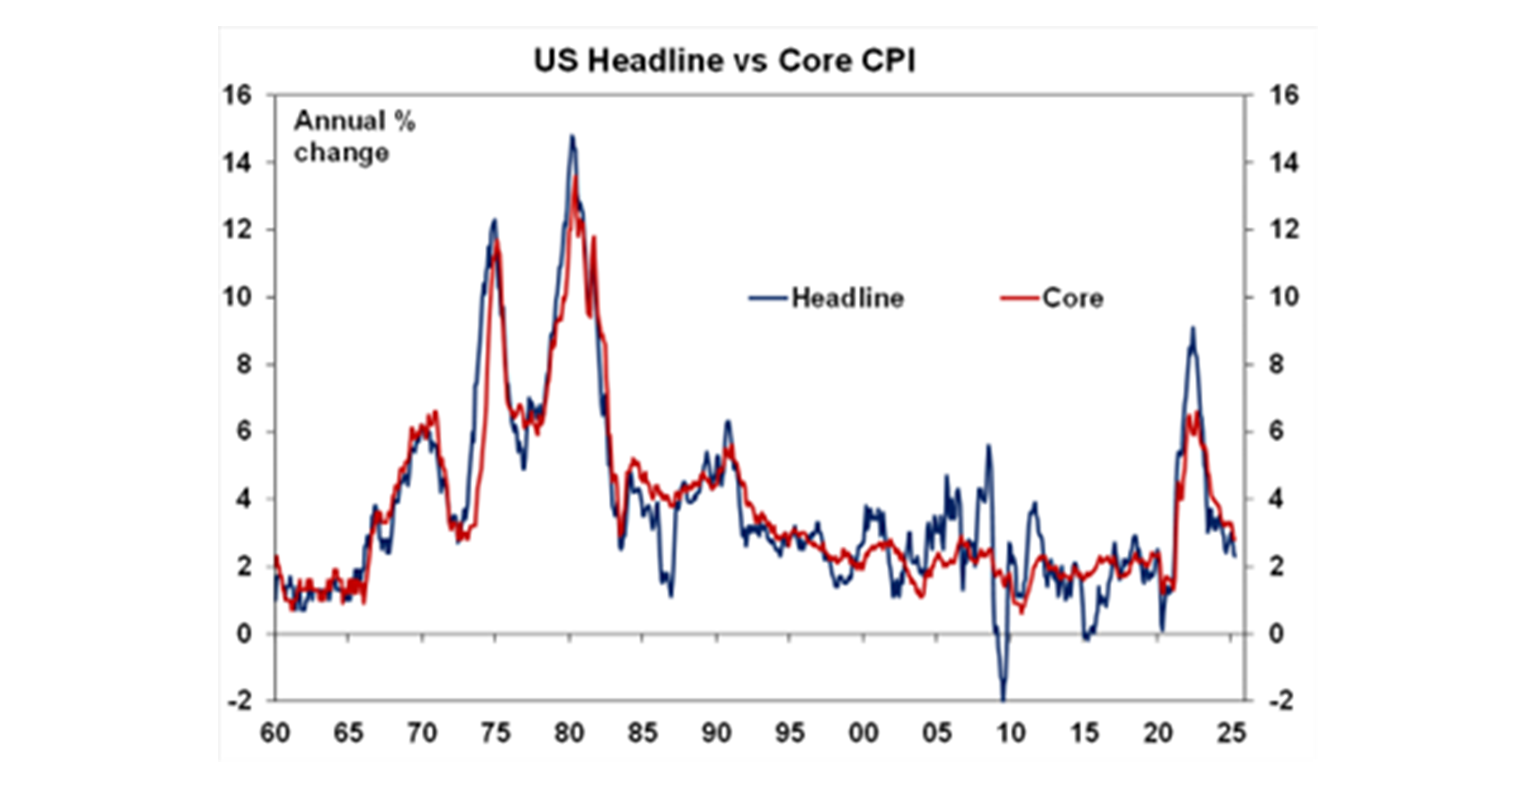
In April, the areas that had the largest contribution to inflation were rents (which looks to be seasonal as forward looking rents have slowed a lot), hospital services and furniture while lower egg prices (finally!), a decline in airline fares and some food prices detracted from inflation.
The impact of the tariffs is yet to hit the inflation data in a significant way. It should come through as a big one-off adjustment to prices (a level change). We expect the US CPI will end the year up by 3%.
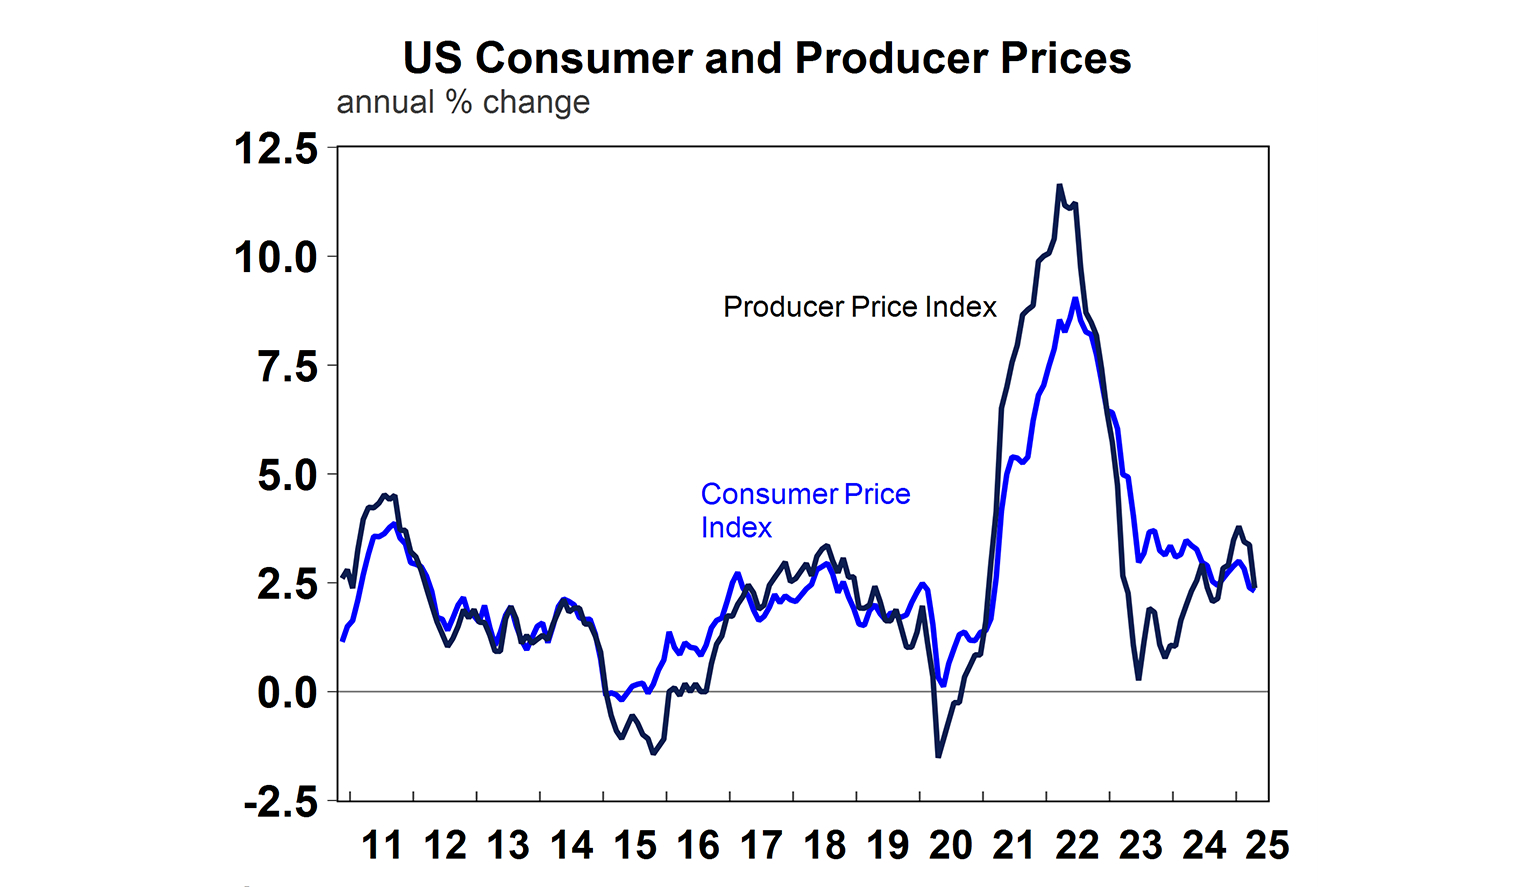
The April producer price index fell by 0.5% (despite expectations for a rise) with annual growth up 2.4% (unchanged on last month). The fall was due to weaker services prices and some are suggesting that this is a sign that businesses are reducing margins, taking the hit from tariffs. Consumer prices are still likely to rise from here.
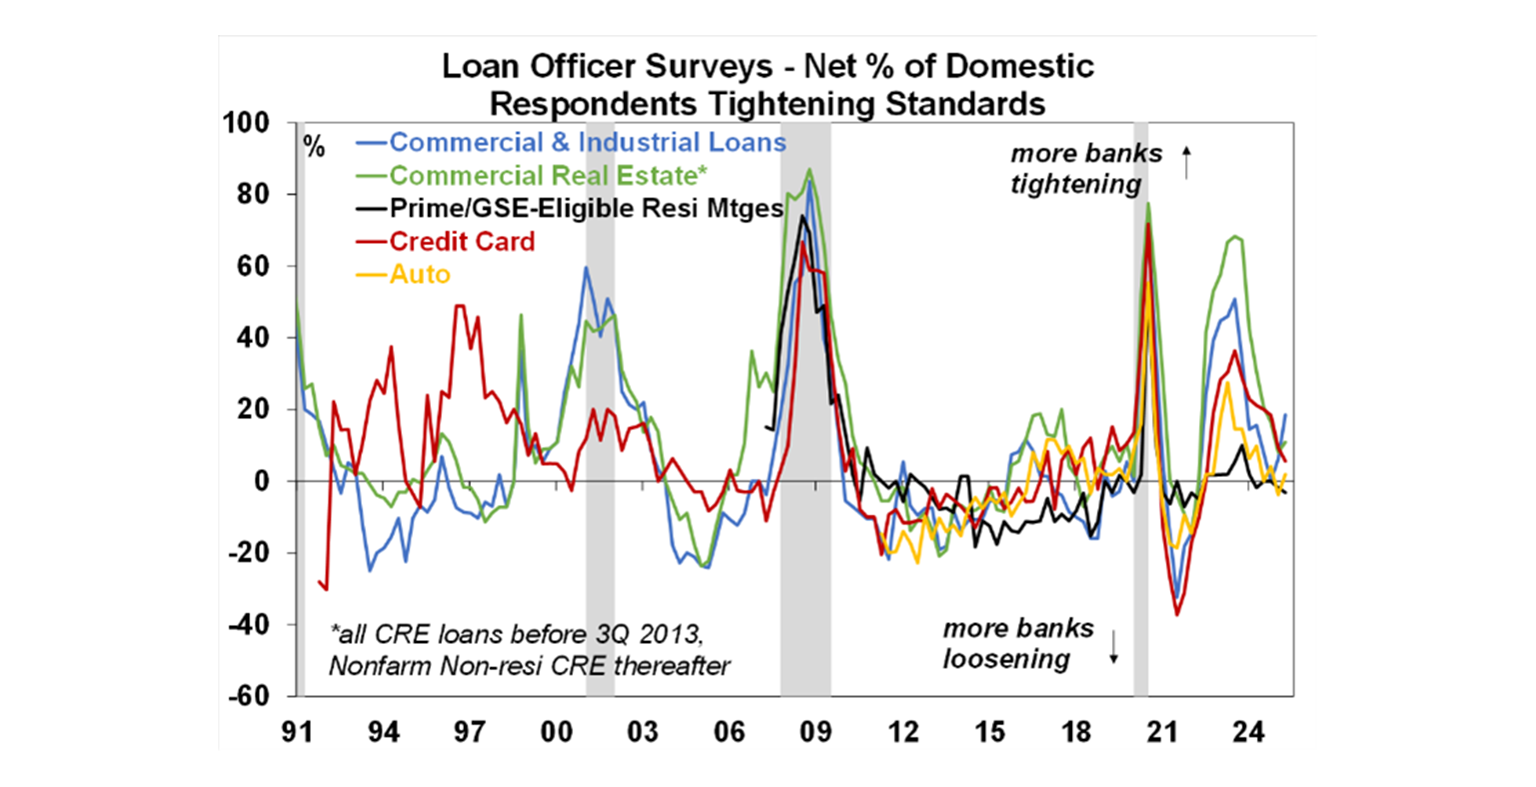
The US Senior Loan Officers Survey showed tighter lending conditions for many loan groups, especially in the commercial sector (see the chart below) which makes sense in a period of elevated bond yields and policy uncertainty.
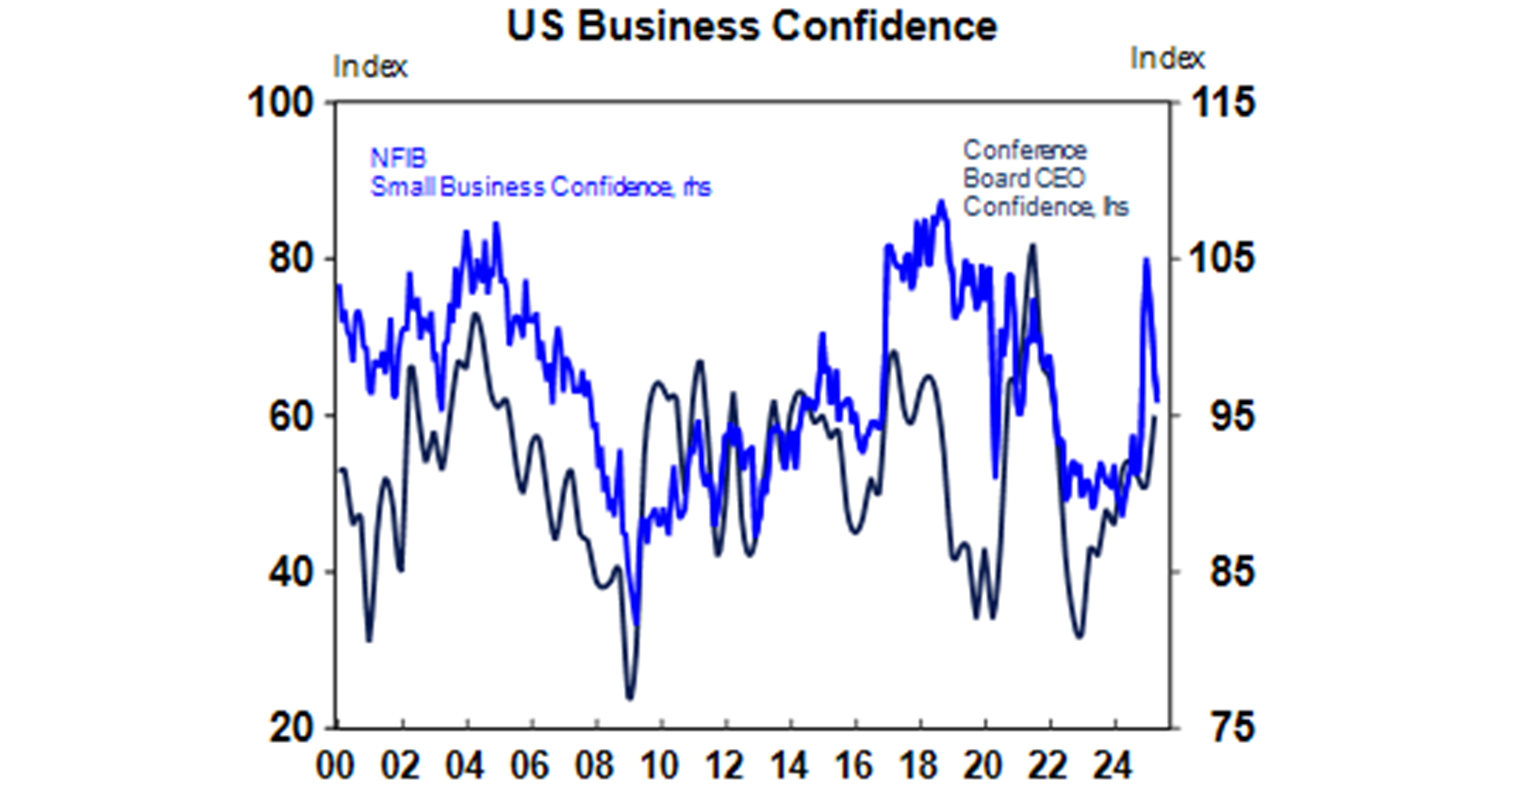
US NFIB small business confidence slumped in April (see the chart below). Interestingly, small business confidence was solid through Trump 1.0.
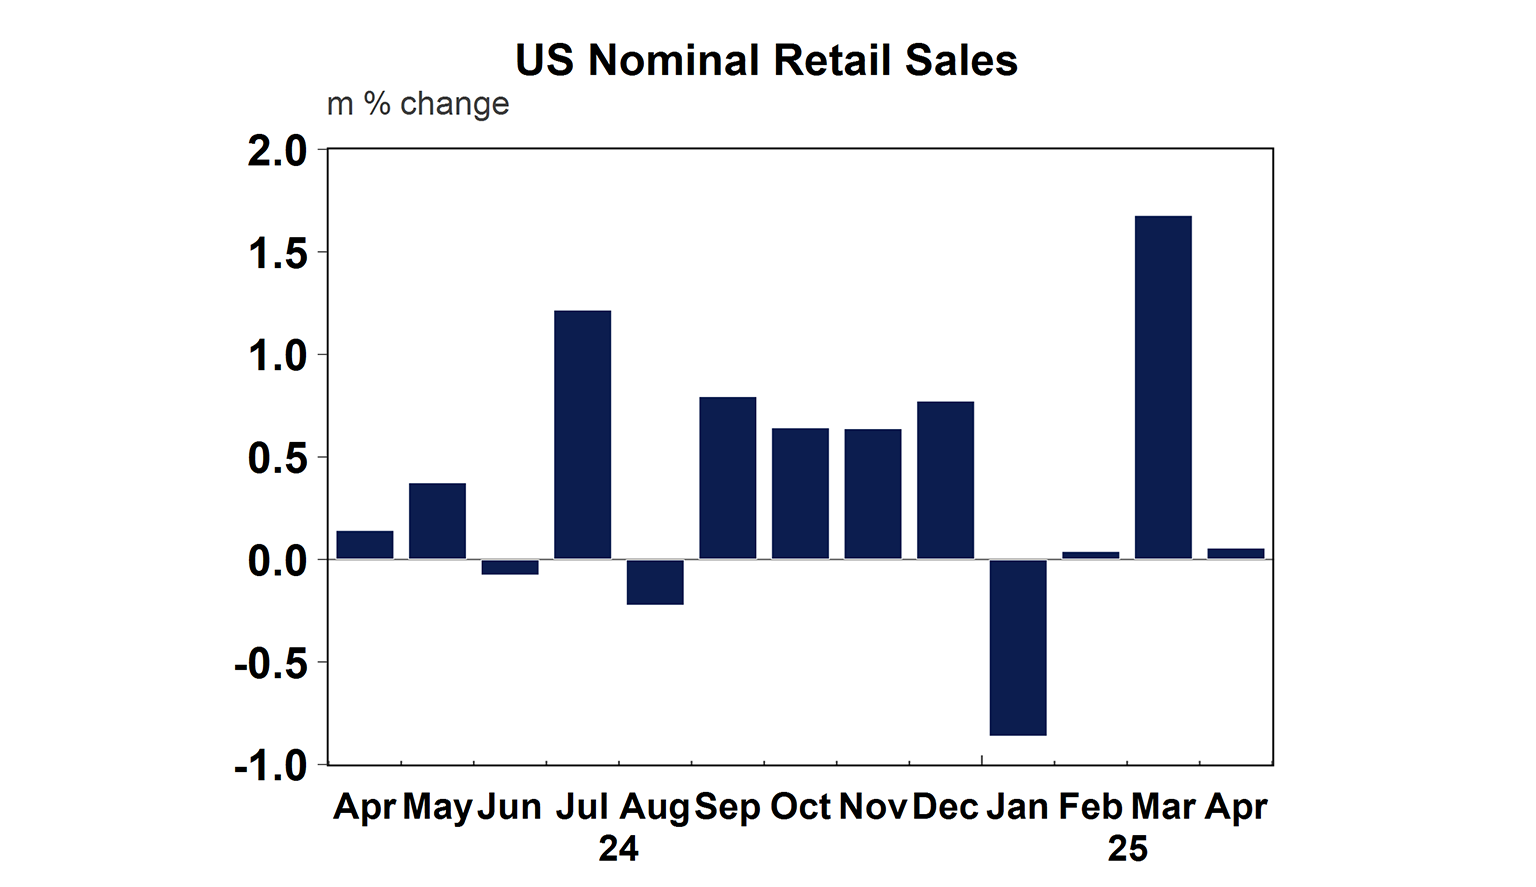
US retail sales data for April was up only 0.1% but this was expected after a strong print last month due to consumer front-running purchases in March. Restaurant spending held up which shows there is still some resilience in discretionary spending.
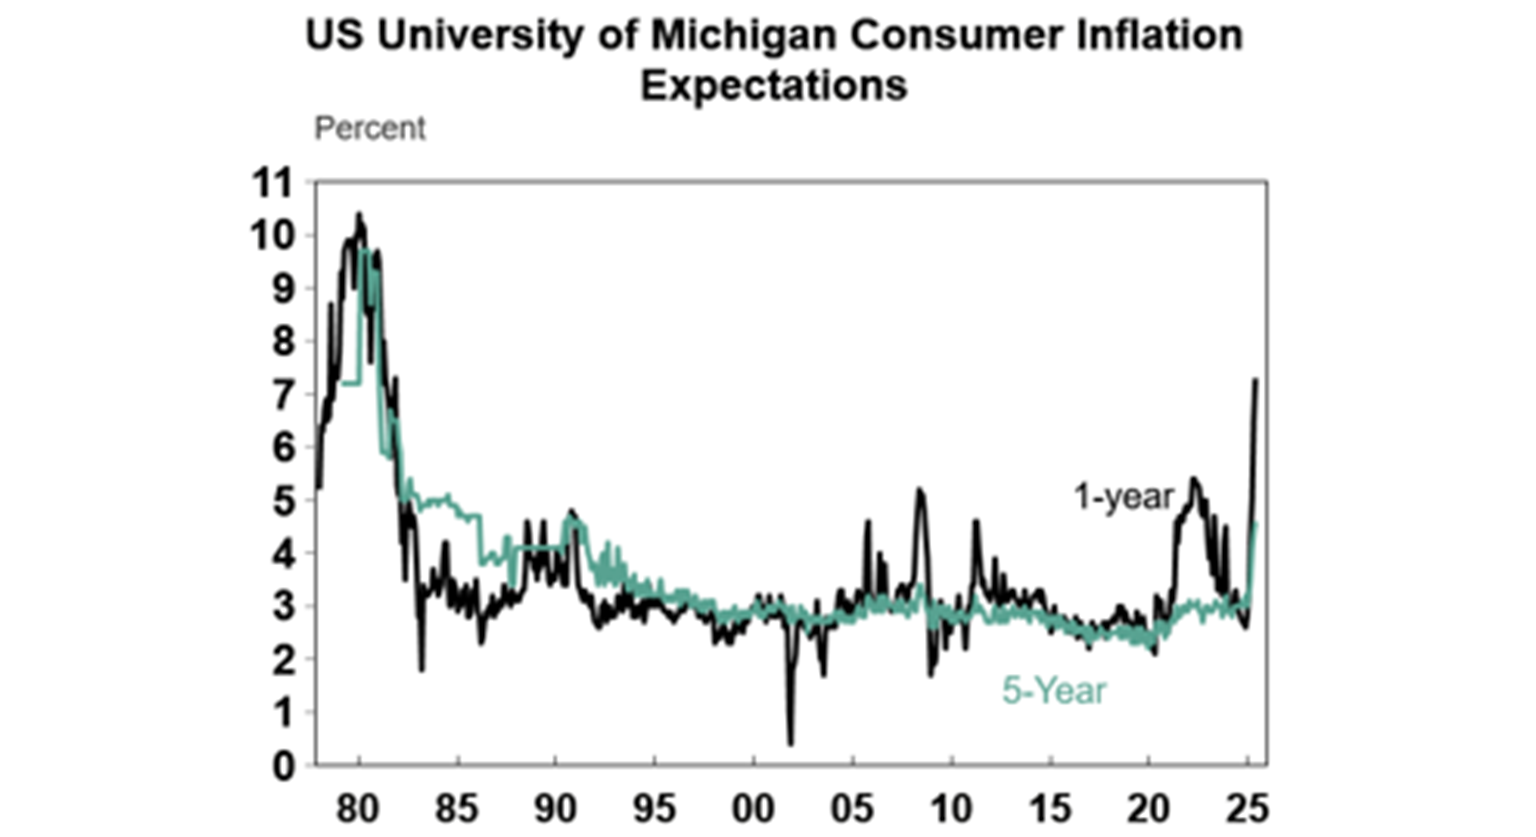
US consumer inflation expectations continue to increase. 1-year inflation expectations now rose to 7.3% (the highest since the early 1980’s) and the 5-year to 4.6% (the highest since the early 1990’s - see the chart below).
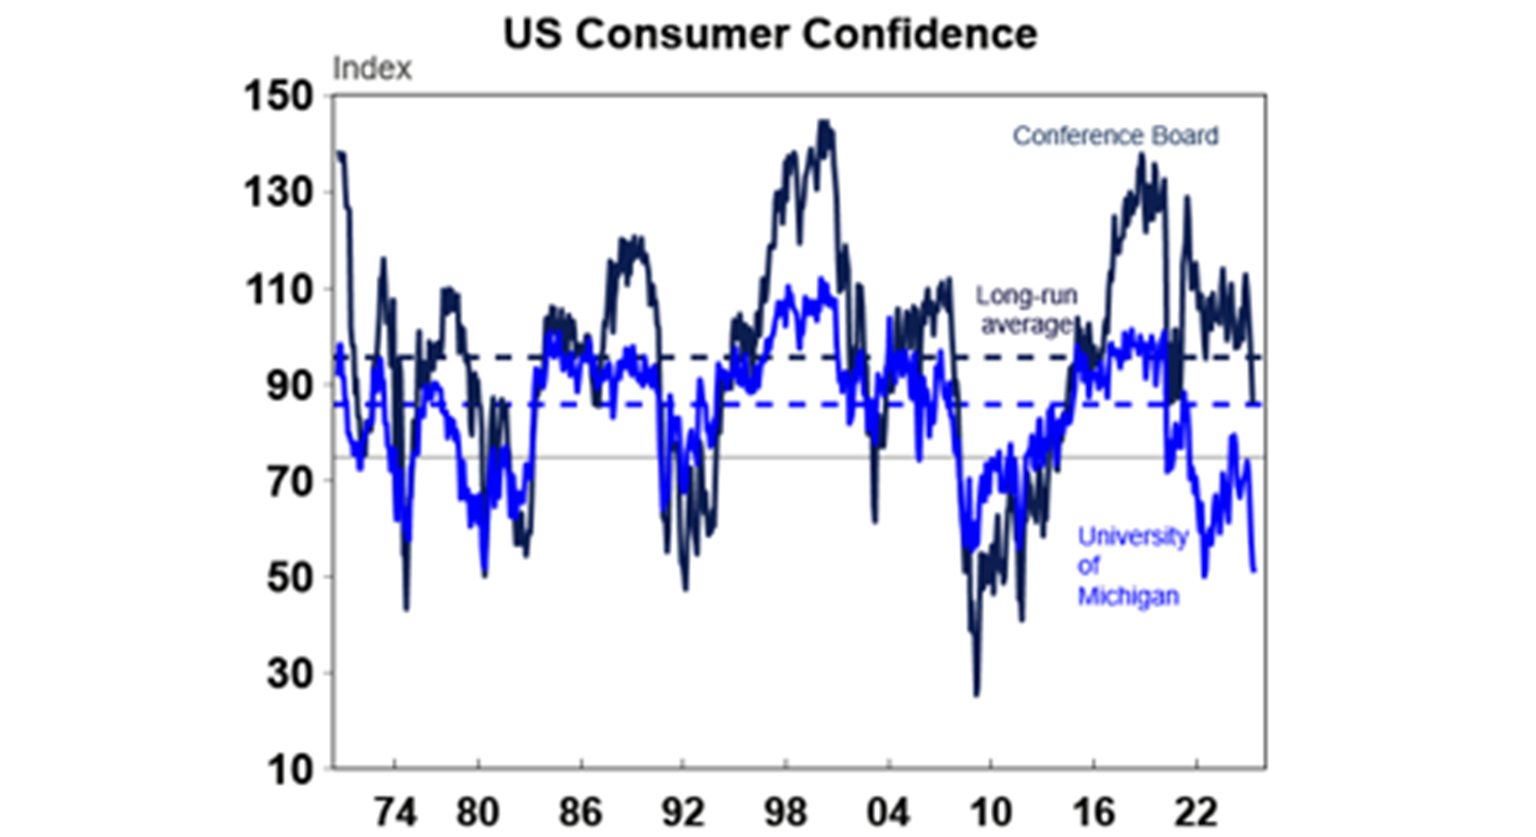
And University of Michigan consumer confidence figures also continue to tank (see the chart below).
Australian economic events and implications
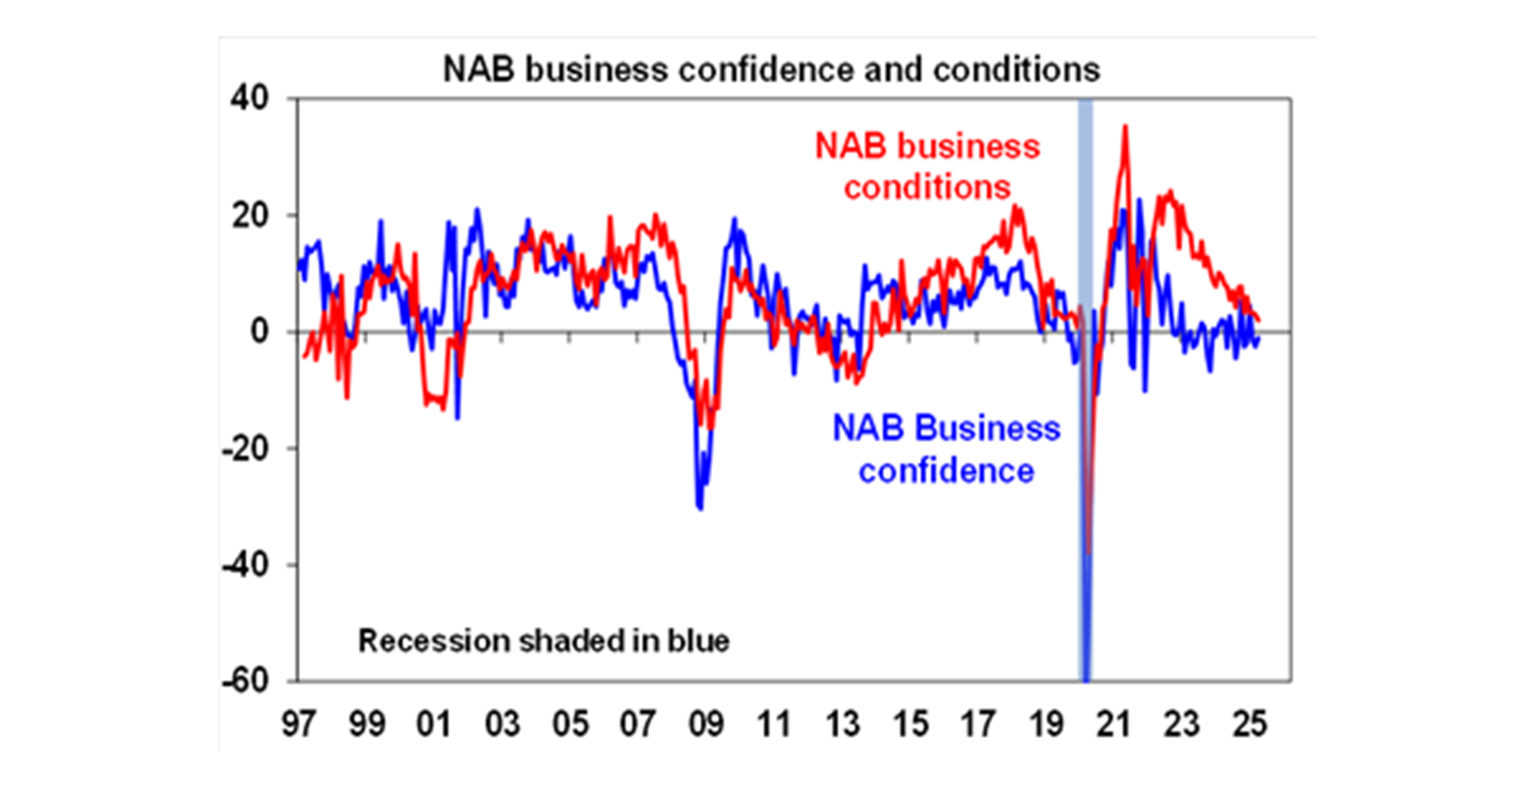
Australian consumer and business confidence showed a slight lift in consumer confidence (although its still negative) and a small rise in business confidence (but its negative too!). Business conditions also deteriorated, which isn’t great for business investment.
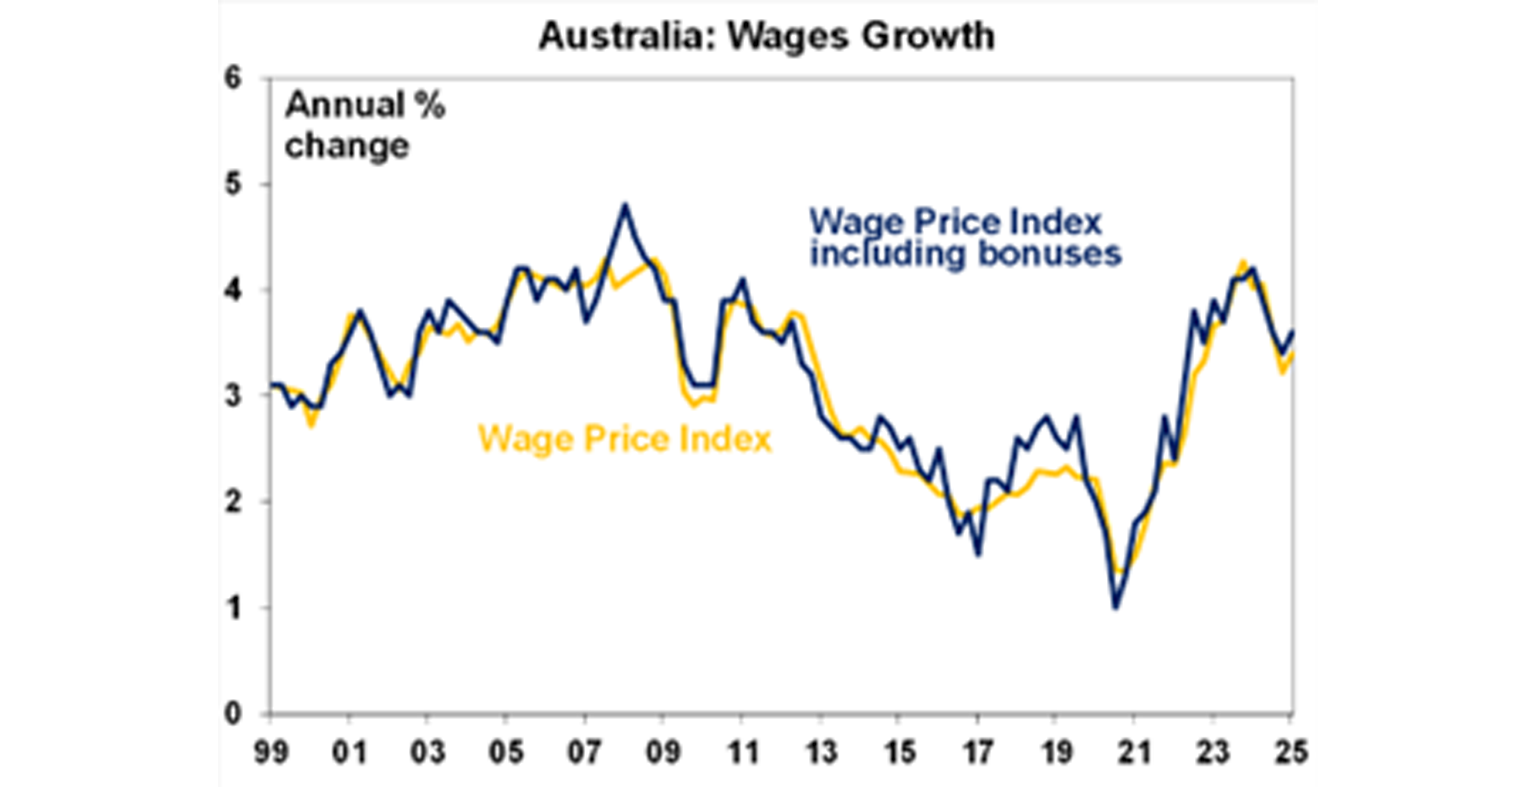
The March quarter wages data was up by 3.4% over the year. Wages growth has slowed from its peak (at just over 4%) as the labour market has slowed a little. In the March quarter, enterprise agreements (related to aged care and child care) pushed up wages.
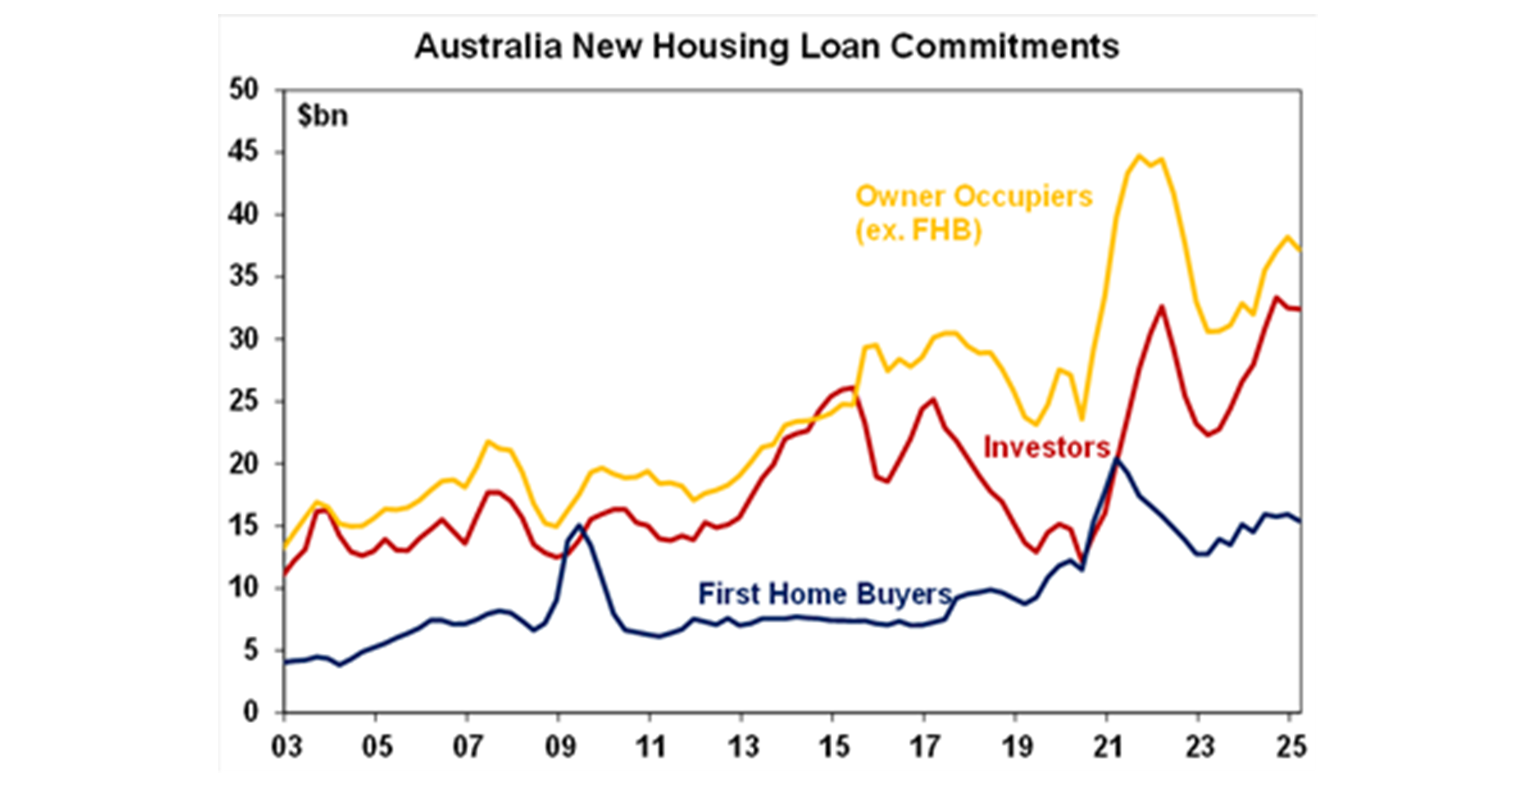
Housing lending fell by 1.6% over the March quarter, with declines in owner-occupiers, investors and first home buyers. A tick up is expected in the June quarter from lower interest rates.
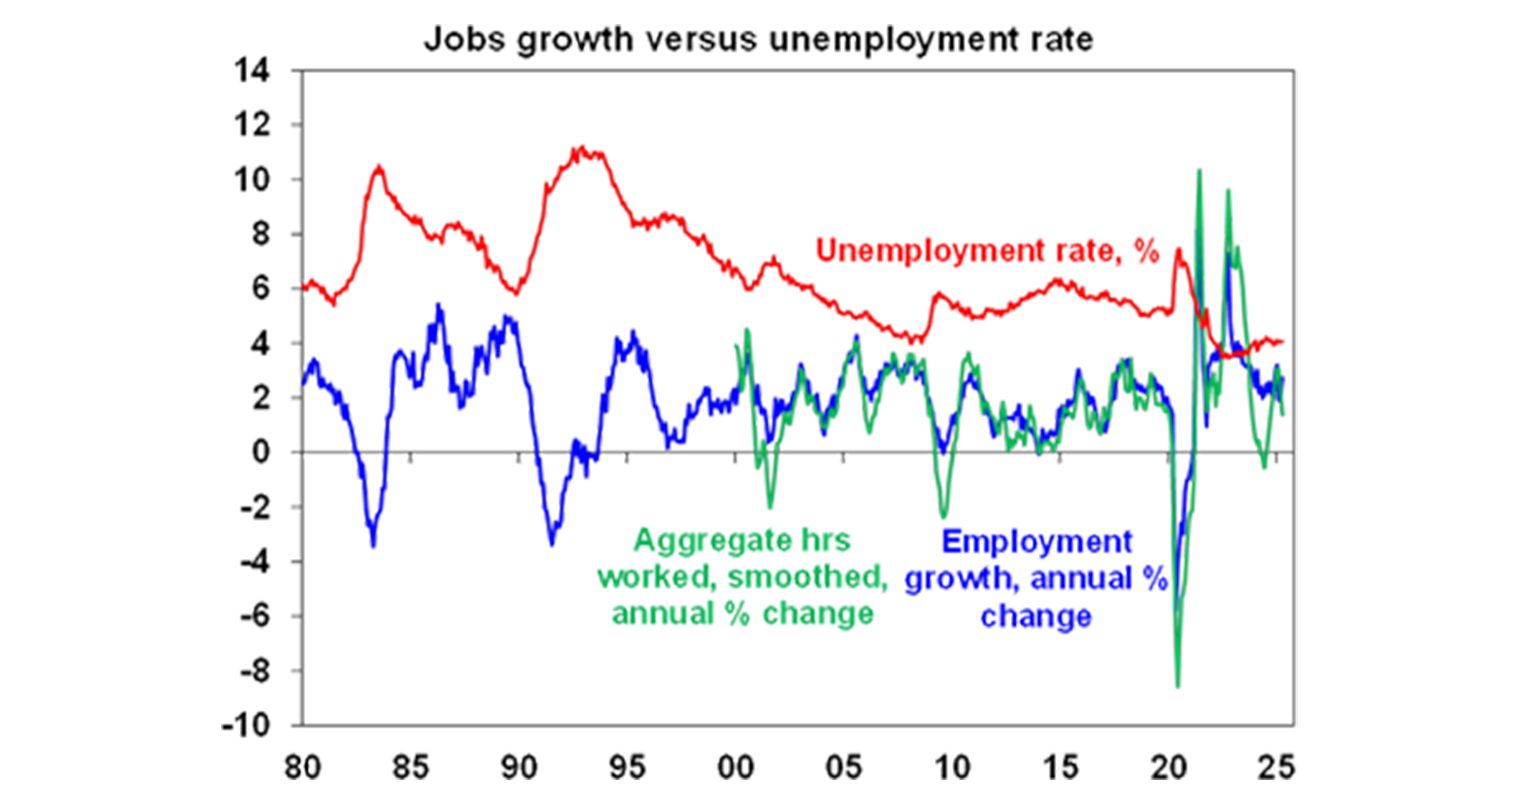
Labour market conditions continue to remain strong in Australia. The April jobs data surprised by rising 89K. The unemployment rate was unchanged at 4.1% (and is still above its 3.5% low). This has been a great outcome achieved by policymakers – lower inflation, but maintaining gains in the labour market. We know from the data in February, that 70% of job gains are tied to public-sector related roles.
What to watch over the next week?
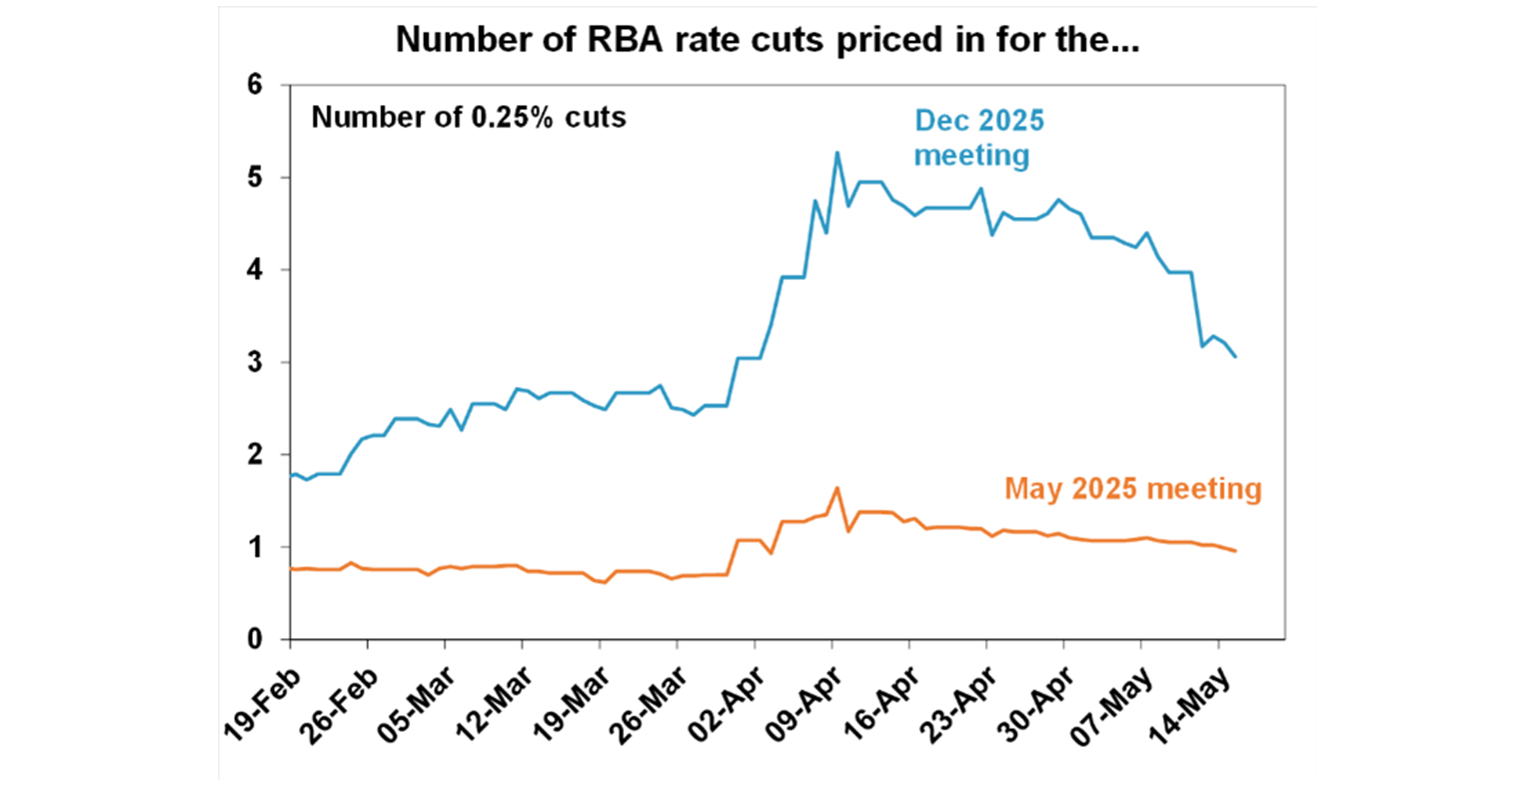
The RBA meets next week and will release its quarterly Statement on Monetary policy which has its updated growth and inflation forecasts. We expect the Monetary Policy Board to cut the cash rate from 4.1% to 3.85%, following the 25 basis point reduction in February. Markets at one stage were looking for 4-5 rate cuts from the RBA by the end of the year which was in response to global trade uncertainty. We always thought this looked way too exaggerated. Markets are implying a 99% change of a 25 basis point cut on Tuesday (see the chart below).
The last time the RBA met was before the Liberation Day tariff announcement. The timing of the meetings has worked out well to give the RBA a little more clarity about the future of US trade policy, and at least some reassurance that the US is willing to make trade deals with its counterparts. Australia’s position in this has not changed. We are little impacted by the 10% US tariff rate as only 5% of our exports go to the US (see detailed note here) and we are not retaliating with our own tariffs, so there is little impact to domestic inflation. The US/China trade deal means that Chinese export growth may not take too much of a hit (and may be offset by policy stimulus anyways) which could slow our exports to China. And imported inflation for Australia may decline if we get cheaper products. Financial markets are not plunging anymore from trade shock announcements. So there is no need for the RBA to panic and cut by 50 basis points to calm market fears.
The March quarter inflation data showed both headline and trimmed mean inflation back in the RBA’s 2-3% inflation target for the first time since 2021. Wages data this week was also in line with the RBA’s forecasts. While employment growth has been solid, the unemployment is still above its lows. And of course, GDP growth is still anaemic. So, the low inflation environment gives the RBA room to remove some policy restrictiveness as interest rates are still “tight”. Even with another 25 basis point rate cut, interest rate settings would still be restrictive (i.e. putting downward pressure on the economy).
The RBA will also consider reasons not to cut the cash rate. Arguments for that would be that employment growth is strong, leading indicators suggest better jobs growth ahead, GDP growth is picking up and services inflation is still a little too high.
At the end of the day we expect the central bank to see more downside risks to the economy from not cutting rates, than upside inflation risks from reducing interest rates. We expect another 0.25% rate cut in August and potentially another in November.
Next week we also get the Victorian state budget and RBA Deputy Governor Hauser will give a speech titled “Open the Door and See the Mountain: Reflections from a Recent Trip to China”.
It’s relatively quiet globally in terms of economic data. Global May PMI indicators will give an update on tariff impacts to business orders and prices.
Monthly Chinese activity data includes industrial production, property investment and the unemployment rate for the month of April.
Outlook for investment markets
Important note: While every care has been taken in the preparation of this document, neither National Mutual Funds Management Ltd (ABN 32 006 787 720, AFSL 234652) (NMFM), AMP Limited ABN 49 079 354 519 nor any other member of the AMP Group (AMP) makes any representations or warranties as to the accuracy or completeness of any statement in it including, without limitation, any forecasts. Past performance is not a reliable indicator of future performance. This document has been prepared for the purpose of providing general information, without taking account of any particular investor’s objectives, financial situation or needs. An investor should, before making any investment decisions, consider the appropriateness of the information in this document, and seek professional advice, having regard to the investor’s objectives, financial situation and needs. This document is solely for the use of the party to whom it is provided. This document is not intended for distribution or use in any jurisdiction where it would be contrary to applicable laws, regulations or directives and does not constitute a recommendation, offer, solicitation or invitation to invest.Shares are at risk of further falls given the ongoing tariff war, increased recession risk particularly in the US and the risk of a US/Israeli strike on Iran’s nuclear capability if diplomacy doesn’t work. Even if the low has been seen volatility is likely to remain high. But with Trump likely to ultimately back down further on the tariffs (after declaring victory of course!) and pivot towards more market friendly policies like tax cuts and deregulation, and central banks, including the RBA, likely to cut rates further shares are likely to recover on a more sustainable basis into year end. But it’s likely to be a rough ride.
Bonds are likely to provide returns around running yield or a bit more, as growth weakens, and central banks cut rates.
Unlisted commercial property returns are likely to improve in 2025 as office prices have already had sharp falls in response to the lagged impact of high bond yields and working from home.
Australian home prices have likely started an upswing on the back of lower interest rates. But it’s likely to be modest with US tariff worries constraining buyers and posing a near term threat of a reversal in prices and affordability remaining poor. We see home prices rising around 3% this year.
Cash and bank deposits are expected to provide returns of around 4%, but they are likely to slow as the cash rate falls.
The $A is likely to be buffeted between the negative impact of US tariffs and the global trade war and the potential positive of a further fall in the overvalued US dollar as its safe haven status comes under question. This could leave it weak around or just below $US0.60 in the near term. Undervaluation should support it on a medium-term view with fair value around $US0.73.
You may also like
-

Oliver's insights - Why have Australian living standards “fallen” and how do we fix it? For the last few years there has been much talk of a “cost-of-living” crisis in Australia and of “falling living standards”. This has flared up again lately with the pickup in inflation resulting in a renewed fall in real wages. -

Weekly market update - 10-07-2026 Ceasefire over but markets are also over the war, Why oil prices can't go too low or too high, Is AI adding to inflation risk or taking it away, and Australia’s wage problem. -

How to protect yourself from phishing and impersonation scams Phishing scams can look like everyday messages – emails, texts or calls. Learn the signs and simple steps to protect your money and personal information.
Important information
While every care has been taken in the preparation of this document, neither National Mutual Funds Management Ltd (ABN 32 006 787 720, AFSL 234652) (NMFM), AMP Limited ABN 49 079 354 519 nor any other member of the AMP Group (AMP) makes any representations or warranties as to the accuracy or completeness of any statement in it including, without limitation, any forecasts. Past performance is not a reliable indicator of future performance.
This document has been prepared for the purpose of providing general information, without taking account of any particular investor’s objectives, financial situation or needs. An investor should, before making any investment decisions, consider the appropriateness of the information in this document, and seek professional advice, having regard to the investor’s objectives, financial situation and needs. This document is solely for the use of the party to whom it is provided.
This document is not intended for distribution or use in any jurisdiction where it would be contrary to applicable laws, regulations or directives and does not constitute a recommendation, offer, solicitation or invitation to invest.