


Weekly market update
Investment markets and key developments
The rebound in shares continued over the last week helped by talk of trade deals, including with China, and Trump continuing to back track on tariffs along with good US earnings reports and solid payrolls.
12 min read

The rebound in shares continued over the last week helped by talk of trade deals, including with China, and Trump continuing to back track on tariffs along with good US earnings reports and solid payrolls. For the week US and Eurozone shares rose 2.9% and Japanese shares rose 3.2%, but Chinese shares fell 0.4%. The positive global lead along with a further fall in underlying inflation supporting the case for an RBA rate cut this month saw the Australian share market rise 3.4% led by IT, property, energy health and retail shares. Bond yields mostly rose with the rebound in share markets, but they fell slightly in Australia. Metal, gold and iron ore prices fell as did the oil price as OPEC discussed a further rise in production. The Australian dollar rose despite a rise in the US dollar and Bitcoin also rose.
Labor returned to government with an increased majority. Based on last year’s experience with the “cost of living crisis” seeing various incumbent governments at elections around the world turfed out it seemed Labor might suffer the same fate. And coming into this year this is just what the polls suggested. But then along came Trump and his mayhem leading to a swing back to centre left incumbents – first in Canada and now in Australia. Of course, there is a lot more to it with Labor running a better campaign with arguably more coherent and less risky policies leading to many deciding to stick with what they know. As Labor’s return to government was flagged by opinion polls it won’t come as a big surprise for most investors and, as it won’t be needing support from the Greens as some had feared could have led to a less business friendly outcome, its return likely just means more of the same and so is unlikely to have much impact on the share market or the $A. And with the budget trajectory looking little different to that announced in the March Budget there are no significant implications for the RBA, although all the extra spending announced since January does mean that interest rates will likely be higher than would otherwise have been the case.
Labor’s key policies are well known:
It’s committed to allowing most first home buyers to get in with just a 5% deposit and its Help to Buy Scheme is about to start up. It’s also ramping up its supply side efforts with a $10bn fund to build 100,000 homes for first home buyers. But its demand side policies are likely to dominate in the near adding more upwards pressure on home prices. What’s new!
Labor has already legislated for ongoing modest tax cuts and have promised a standard $1000 pa tax deduction.
Labor has continued the electricity bill rebates to December, with battery subsidies and a continuing push to renewables to supply 82% of electricity by 2030.
Most of Labor’s policy measures were announced prior to or in the March Budget which saw a $35bn fiscal easing over five years and it claims that the measures it announced after the Budget will be covered by further savings from more cuts to consultants and increased student visa fees, with the budget being $1bn better off over the next four years. So basically, the fiscal situation remains as outlined in the Budget. That said budget data for the financial year to date to March suggests that the 2024-25 deficit could actually end up being substantially smaller than the $28bn deficit forecast in the Budget, as the jobs and commodity price driven revenue windfall continues.
The election campaigns from both major parties were a disappointment for those looking for measures to boost productivity and hence living standards and impose more budget discipline. In the end all we got was band aid solutions and a spendathon of promises leaving the budget on track for deficits for at least the next decade unless there are more big budget revenue windfalls and little hope of policies to fundamentally boost living standards and strengthen the economy in the face of serious challenges to global trade posed by Trump’s trade war. Maybe it’s too much to hope for anything more in an election campaign absent a major crisis.
The election campaign was lacking in fiscal responsibility, but the risk of Australia losing its AAA credit rating is low. S&P has warned that a downgrade was a risk if election promises resulted in larger structural budget deficits and debt than expected. Our assessment is that the risk is low as deficit and debt projections look little different from that outlined in the March Budget. However, this election has been marked by a raft of election promises that started back in January with little commitment to balancing the budget in a reasonable timeframe. While the budget projections may not be that different to what was in the March Budget, that Budget had already seen an extra $35bn in net spending promises compared to the December budget update. And, S&P is right to be concerned about the increasing use of “off budget” funds (covering the NBN, Snowy Hydro, the Housing Australia Fund, etc) which don’t add to the underlying cash deficit but do add to debt. These funds are weakening budget discipline and are contrary to the Charter of Budget Honesty which needs to be reviewed.
But while we all might grumble (and we economists love to!) the really really good news is that we are in one of the world’s few “full democracies” – there are just 24 according to The Economist Intelligence Unit, where elections proceed smoothly and the outcome is respected. A big thanks to all those who put their hand up to represent us (I reckon it would be a tough job) and the AEC for running and umpiring our elections. My favourite quote from election night came from the PM: “What we do here in Australia is we treat people with respect.”
…anyway after all that local fun it's now back to Trump, who will likely remain the main driver of investment markets for a while yet.
Trump’s first 100 days have seen a roller coaster ride in share markets. Trump’s term started with optimism evident in share markets hitting record levels on expectations that he would focus mostly on the positive aspects of his agenda – tax cuts and de-regulation – with tariffs taking a back seat. This turned out not to be the case as he announced far more aggressive tariffs than he indicated in the election campaign. This along with a messy and confusing delivery and uncertainty about what the end point saw shares plunge and bond yields start to surge as investors fretted about recession and a loss of confidence in US economic management and the status of the US as a safe haven. Trump and team then got worried at the prospect of financial panic, a bear market and recession and have been back tracking over the last few weeks – with delays to allow trade deals, an openness to cutting the tariffs on China and a scaling back or exemptions from some tariffs (notably in relation to computers and smart phones and then autos). This has helped markets settle with US, global and Australian shares now having recovered more than half of their losses from their highs early this year to their early April lows and bond yields settling down again. Trump’s backdown is good news and indicates that financial markets (eg bond vigilantes) and fear of recession in the US still pose a constraint on Trump.
However, its still too early to say that we have seen the bottom in share markets or end of the wider market turmoil.
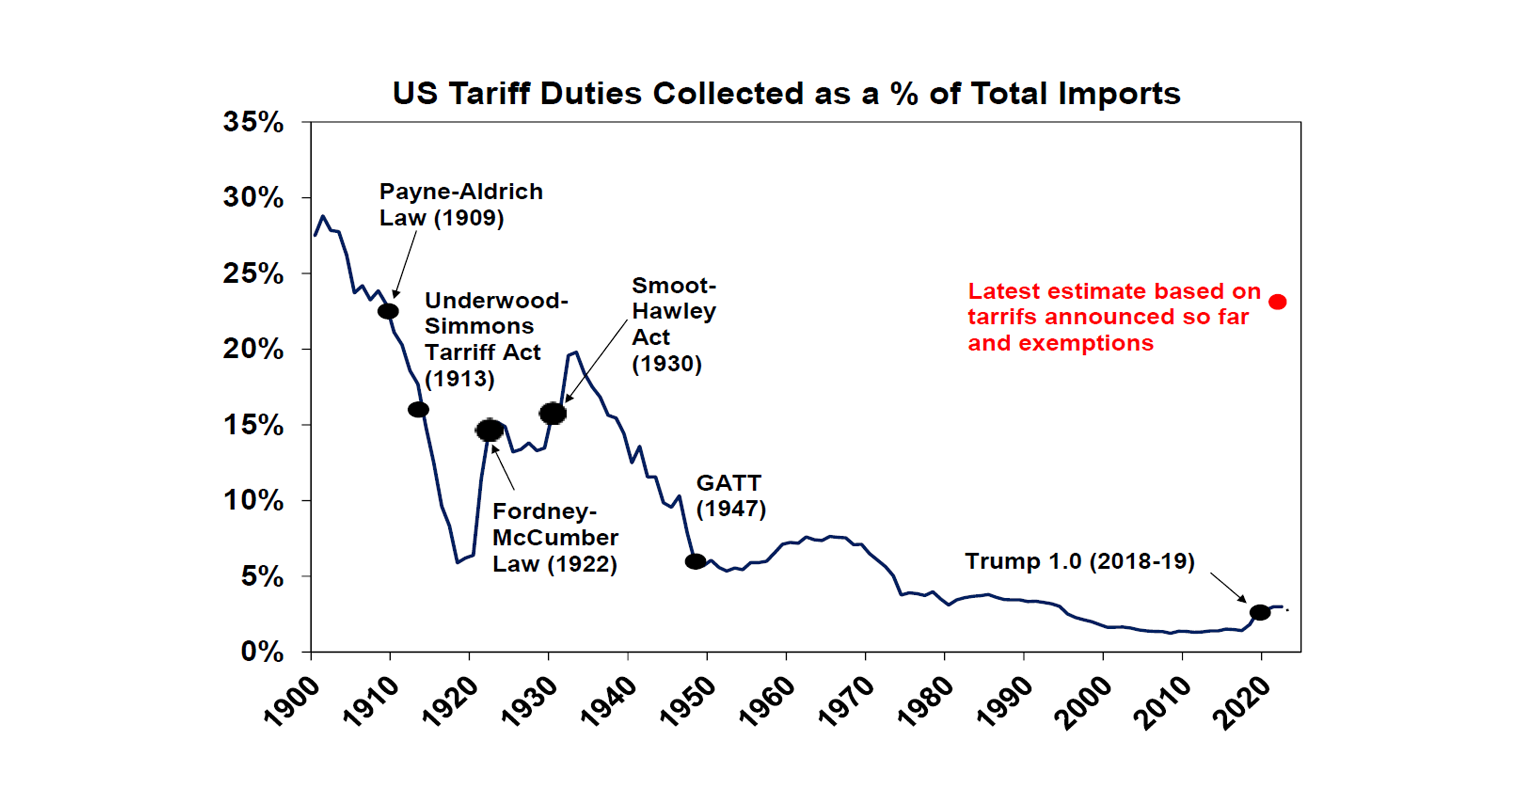
Despite the tariff backdowns the effective average tariff rate on imports coming into the US will still be around 23% which is way up on 3% last year and back to levels of early last century.
It’s unclear how much progress will be made in terms of tariff deals. Some look to be more like agreements to negotiate which means the situation could easily flare up again. Europe does not appear to be rushing to negotiate. And China is now reportedly assessing the possibility of talks but only after the US contacted it (in contrast to Trump’s position that China had to contact the US first) and China still looks to be demanding that the US scrap the tariffs before negotiations begin.
Trump has flagged more tariffs ahead for things like semi-conductors and pharmaceuticals
The shock and uncertainty of the tariff announcements has already created significant damage. This is so far only evident in hits to confidence. Yes, US GDP fell in the March quarter, but this was due to imports front running the tariffs not weak demand (yet). But the impact of the tariffs will likely show up in hard economic data in the months ahead as supply chains are disturbed and spending, hiring and investment decisions are delayed due to the hit to confidence leading to a weaker profit outlook. There are some hints of weaker hard data in reports of falling shipping and travel to the US.
The issue of Fed independence may flare up again as long as the Fed remains in wait and see mode and as Trump looks for someone to blame for weakening economic conditions.
The rebound in share markets and easing in financial conditions since early April could re-embolden Trump to go hard again on tariffs.
There is some evidence of a positive correlation between US share market returns in a president’s first 100 days and the total return through the president’s term. So Trump’s poor start does not augur well. See the next chart.

So, with more to go on the tariff front and related fall out it remains too early to say that we have seen the low in US, global and Australian shares. Ultimately though we continue to see Trump backing down on tariffs and settling at a lower average tariff rate than the 23% currently and pivoting to focus more on tax cuts and deregulation which along with more central bank rate cuts including from the Fed around mid-year should see shares stage a more sustainable recovery in the second half of the year.
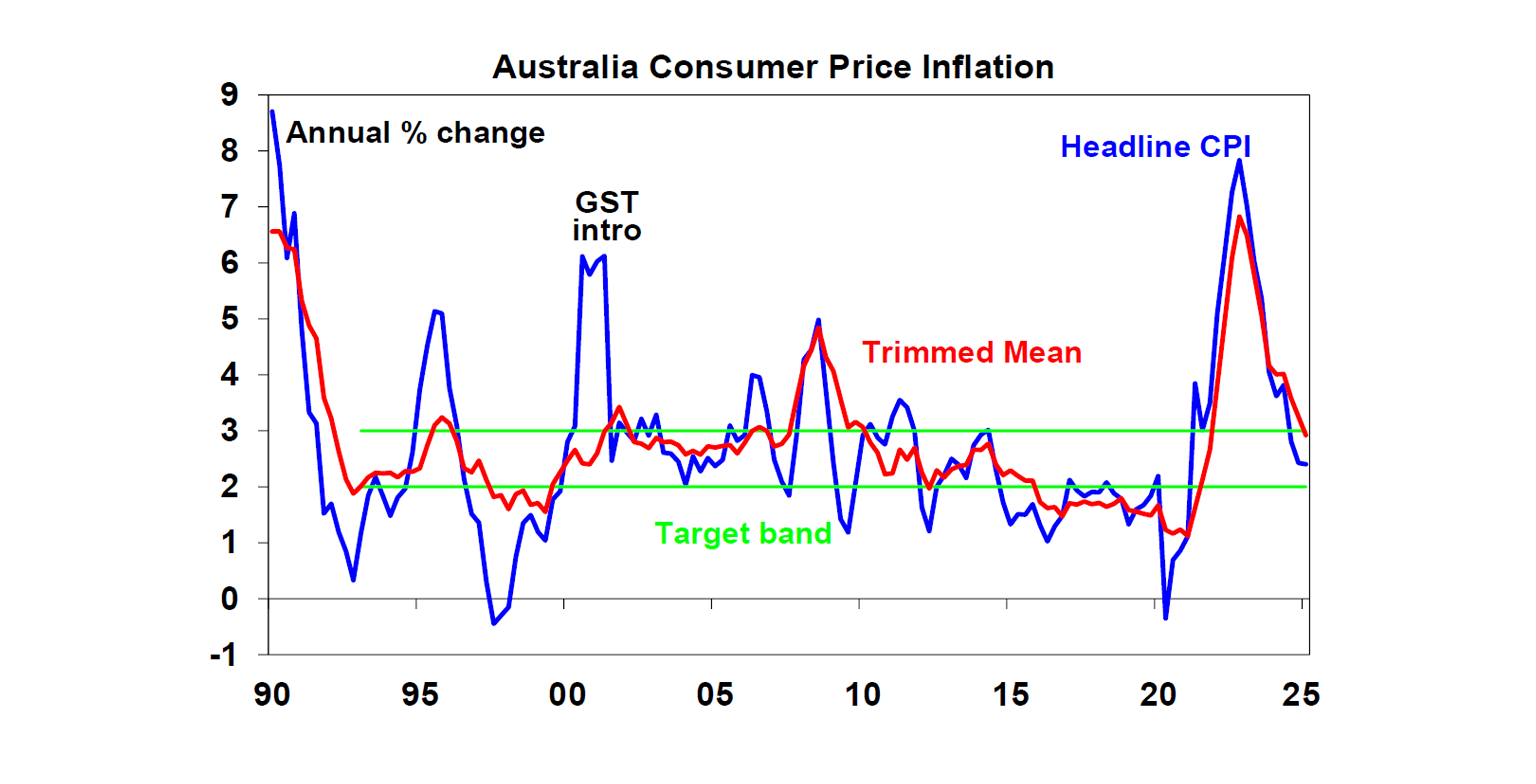
In Australia, March quarter inflation data added to confidence that the RBA will cut rates again when it meets later this month. While the key trimmed mean (or underlying) inflation rate came in slightly stronger than expected at 0.7%qoq as opposed to our forecast for a 0.6%qoq rise the good news on inflation is continuing. In particular: both headline inflation at 2.4%yoy and underlying inflation at 2.9%yoy are now in the target range; underlying inflation averaged an annualised 2.4% over the last six months which is at the mid-point of the target range; goods price inflation is running around pre-covid levels, services inflation is continuing to fall and is now at its lowest in nearly three years; and market sector price inflation is around 2%.
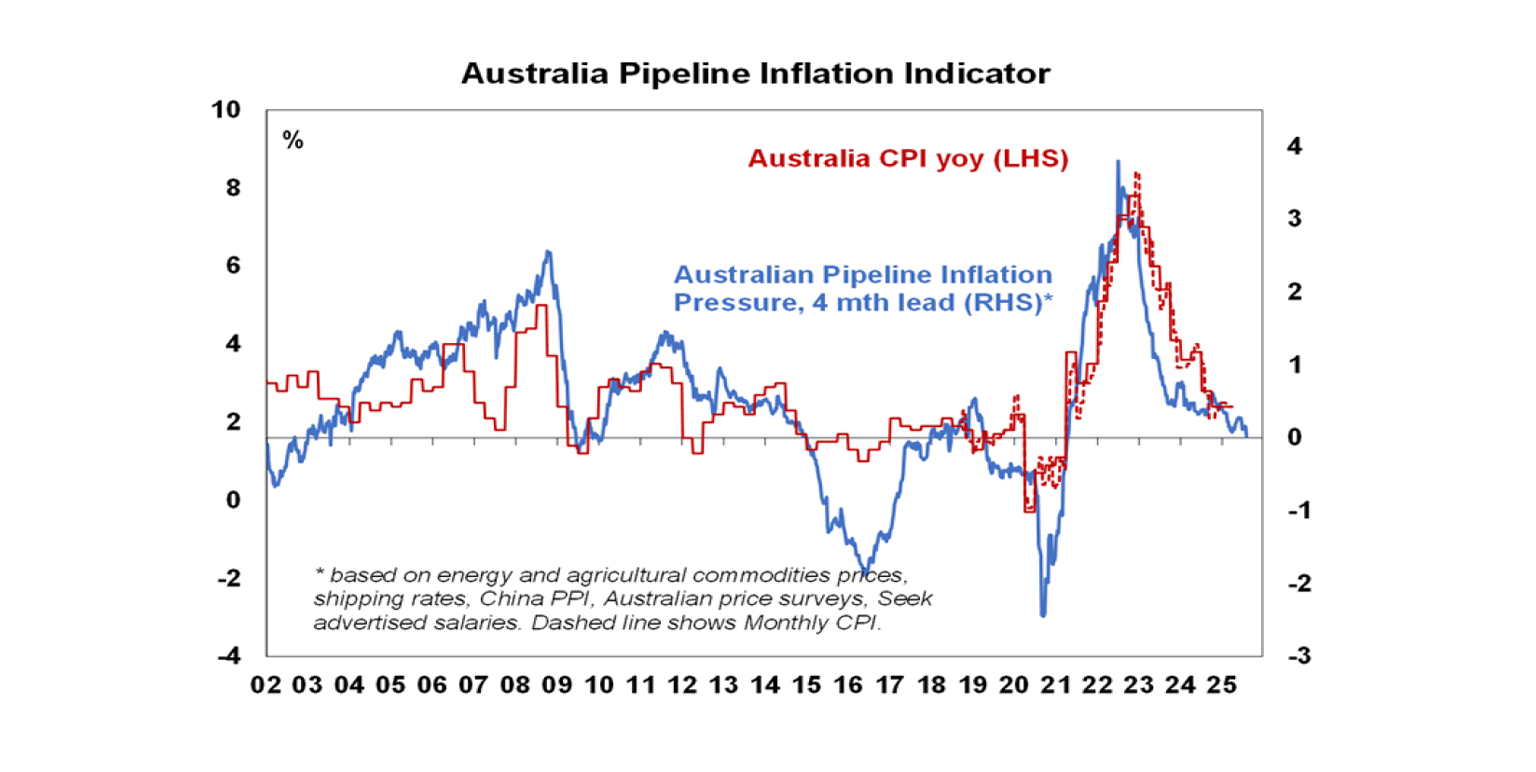
What’s more, our Australian Inflation Indicator points to a further fall in inflation ahead.
With underlying inflation continuing to trend down in line with the RBA’s forecasts, the March quarter inflation data is likely to have added to its confidence that inflation is heading sustainably back to target. So, with monetary policy still tight and Trump’s trade war pointing to downside risks to the growth outlook we remain of the view the RBA will cut the cash rate again by another 0.25% on 20th May with a further 2 or 3 cuts into early next year.
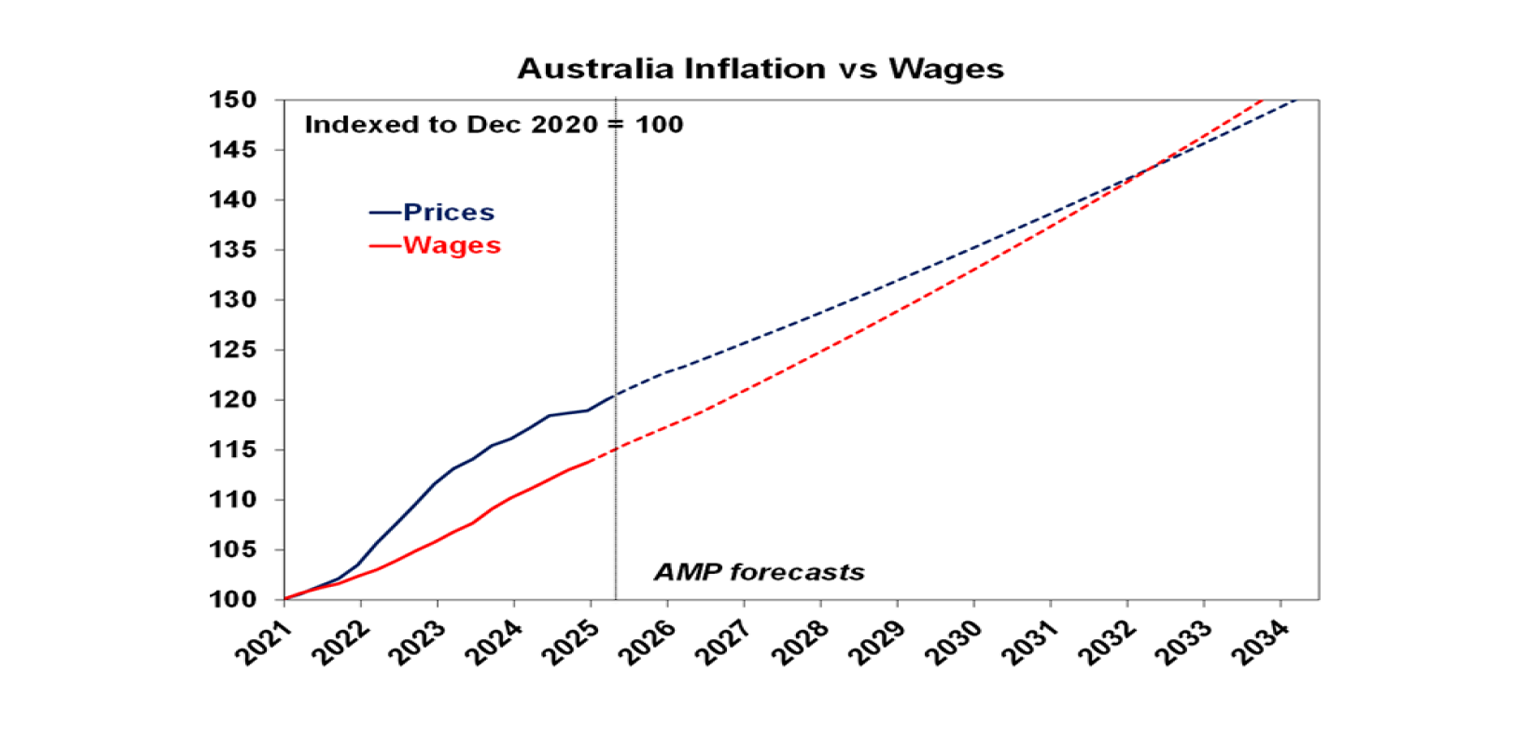
Of course, none of this is to say that the “cost of living crisis” in Australia has gone away. Since 2020 average consumer prices are up 20% but average wages are up just 15%. Wages growth is now running above inflation but at the current rate real wages won’t catch up to their December 2020 level until around 2032. The only way to sustainably address this is to boost productivity!
Major global economic events and implications
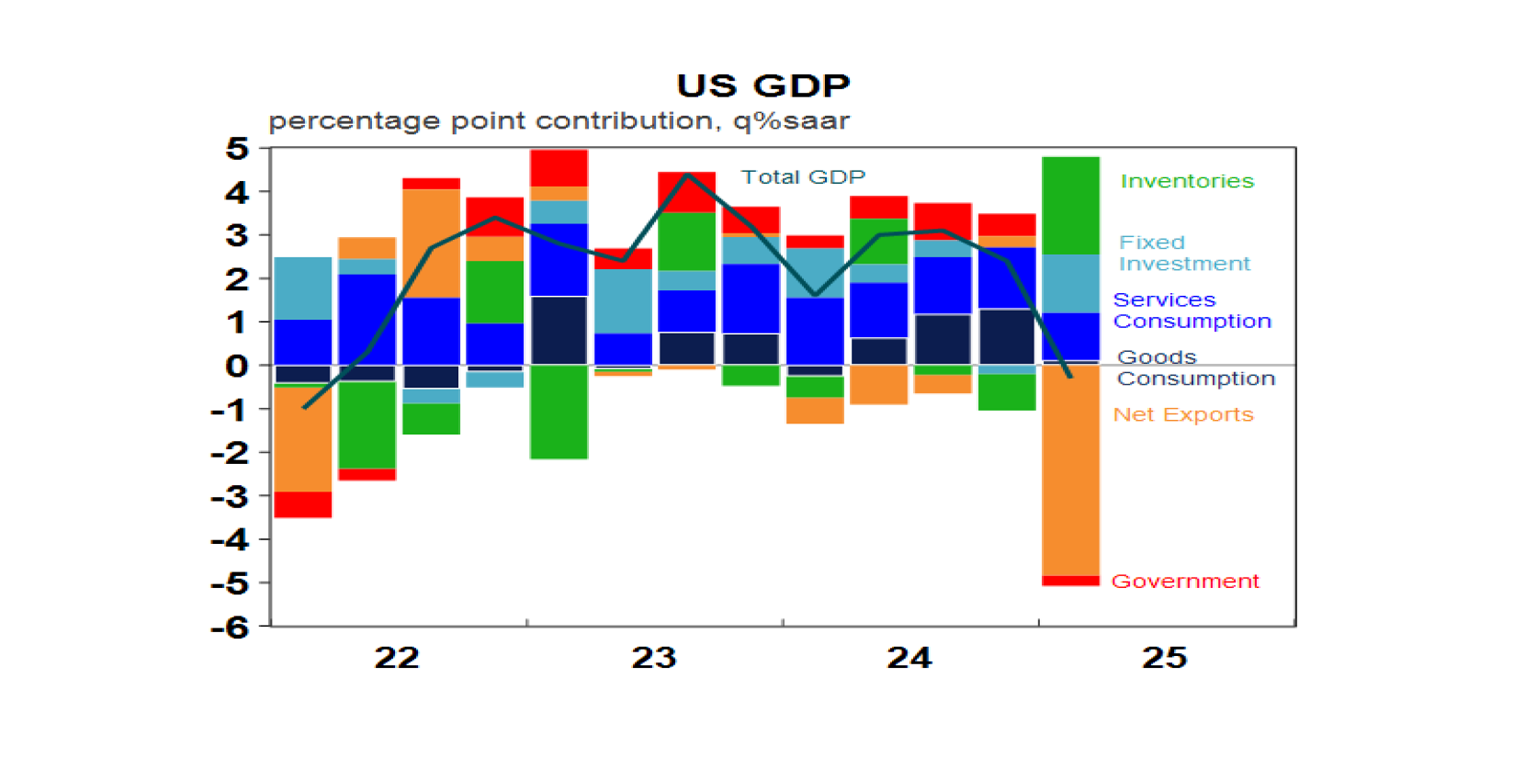
US economic data was mostly weak, but not as weak as suggested by the 0.3% annualised fall in March quarter GDP. This has been reported as a sign that the US is already entering recession, but the fall was solely due to a 51% annualised surge in imports ahead of the tariffs which meant that net exports knocked 4.8% percentage points off GDP. Adjusting for this and a positive contribution to growth from inventory, domestic final sales growth was actually a reasonable 2.3% annualised with strong growth in investment and okay but slowing growth in consumer spending. In other words, while the US is at risk of going into recession what we saw in the March quarter isn’t it!
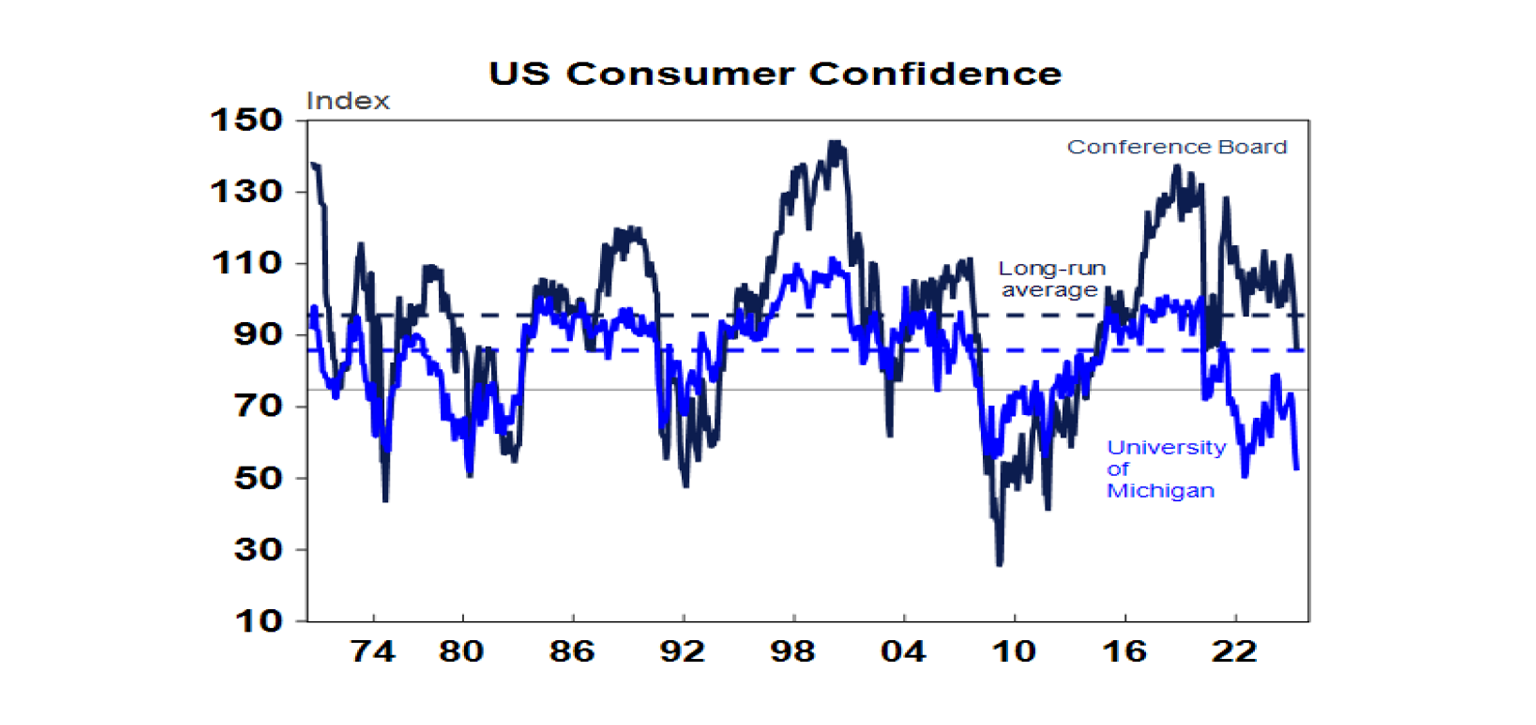
That said other US economic data was soft. Yes, pending home sales rose in March and home prices are still rising, but the former is flat on a year ago and home price gains are slowing. Meanwhile, consumer confidence fell sharply in April with consumers less positive on the jobs market. And the ISM manufacturing conditions index fell in April with prices paid continuing to rise.
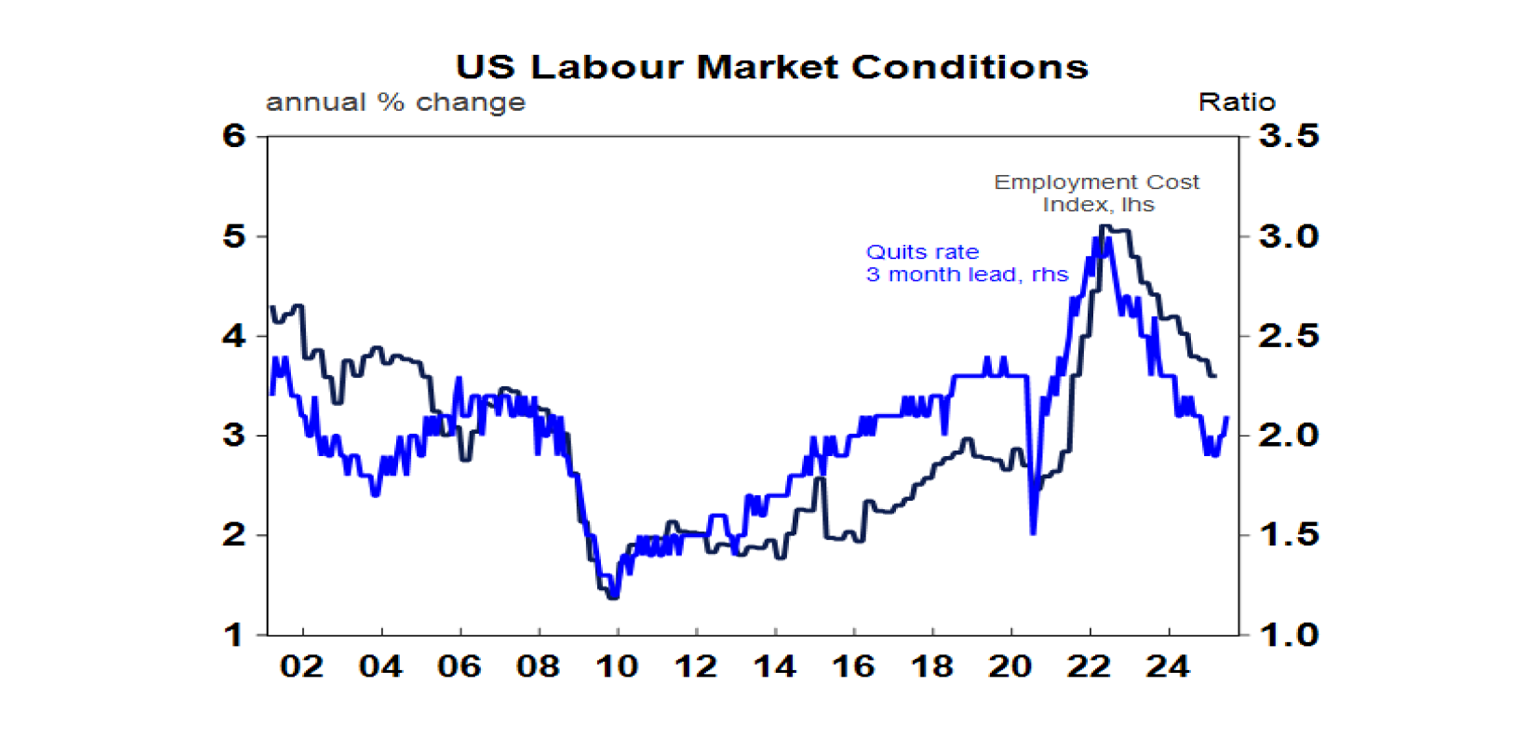
And jobs data was messy. Payrolls rose a solid 177,000 in April with unemployment flat at 4.2%, but payrolls for the prior two months were revised down and job openings in March fell. Meanwhile, growth in employment costs slowed further to 3.6%yoy with the downtrend in quits pointing to a further slowing. And core private final consumption inflation slowed to 2.6%yoy in March, but of course this was before the impact of tariffs shows up. With unemployment remaining low the Fed is likely to remain in wait and see mode with no hurry to start easing rates for now.
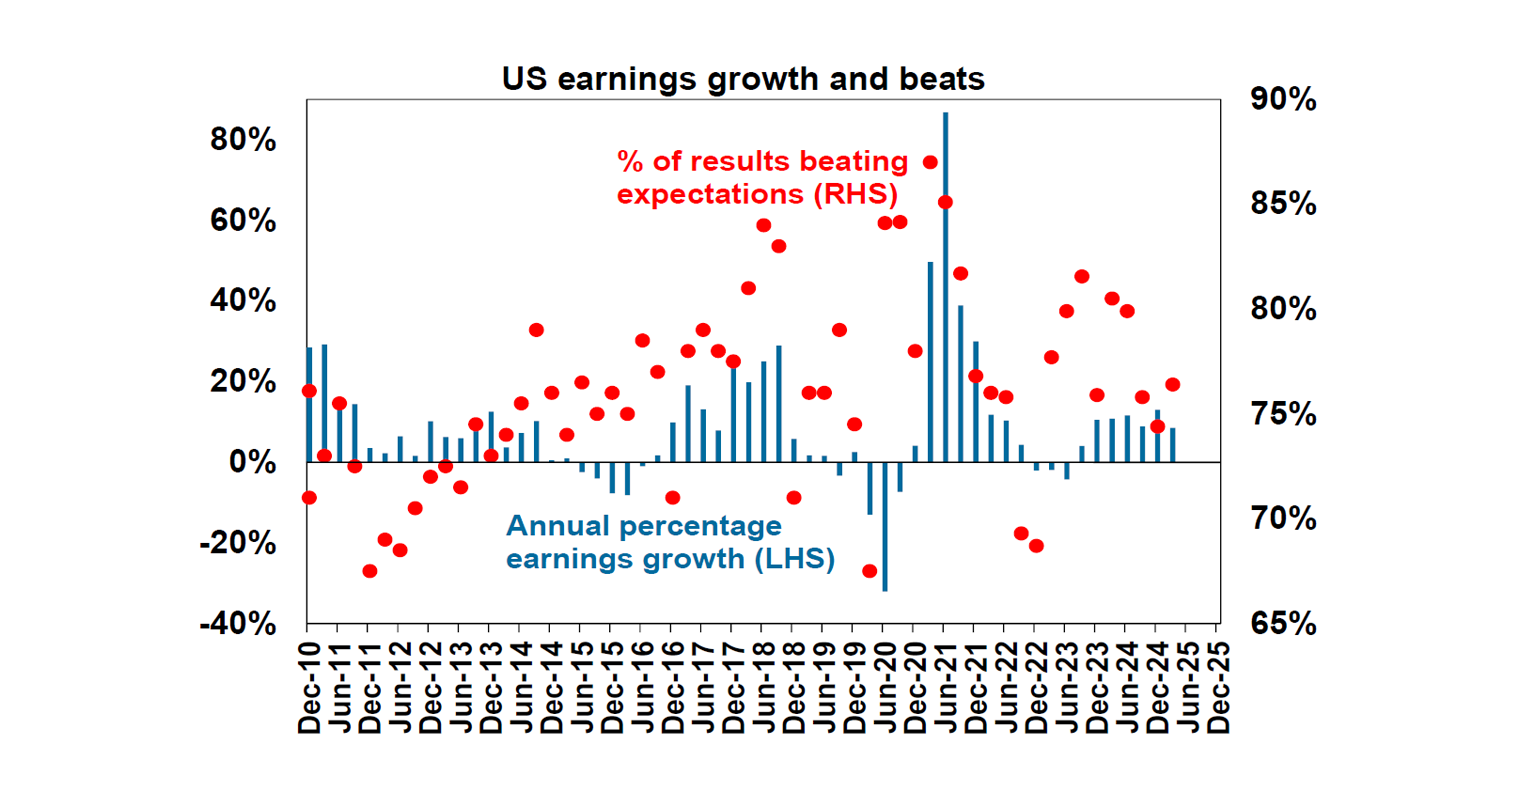
Meanwhile, US earnings growth appears to be holding up well. 71% of S&P 500 companies have reported March quarter results with 76% beating expectations which is around average and consensus earnings expectations have risen to 9.55%yoy and look likely to come in around 10.1%yoy, up from 4.1%yoy two weeks ago. That said numerous companies including Apple have highlighted the threat from the tariffs.
Eurozone GDP growth came in stronger than expected in the March quarter at 0.4%qoq or 1.2%yoy but this was boosted by a 20% annualised rise in exports to the US, front running the tariffs (and mirroring the surge in US imports) and so may not be sustained. Meanwhile, Eurozone economic confidence weakened in April, although the fall is modest compared to that seen in the US. March unemployment was flat at 6.2%. While core CPI inflation for April rose more than expected to 2.7%yoy this was possibly due to Easter distortions. With most economic data, wages growth and trade risks pointing to ongoing falling inflation the ECB remains on track to cut rates again in June with another two cuts likely after that this year.
The Bank of Japan left rates at 0.5% and revised down its growth and inflation forecasts with risks seen as on the downside and doesn’t appear to be in a rush to raise rates. Industrial production, retail sales and unemployment were weaker than expected.
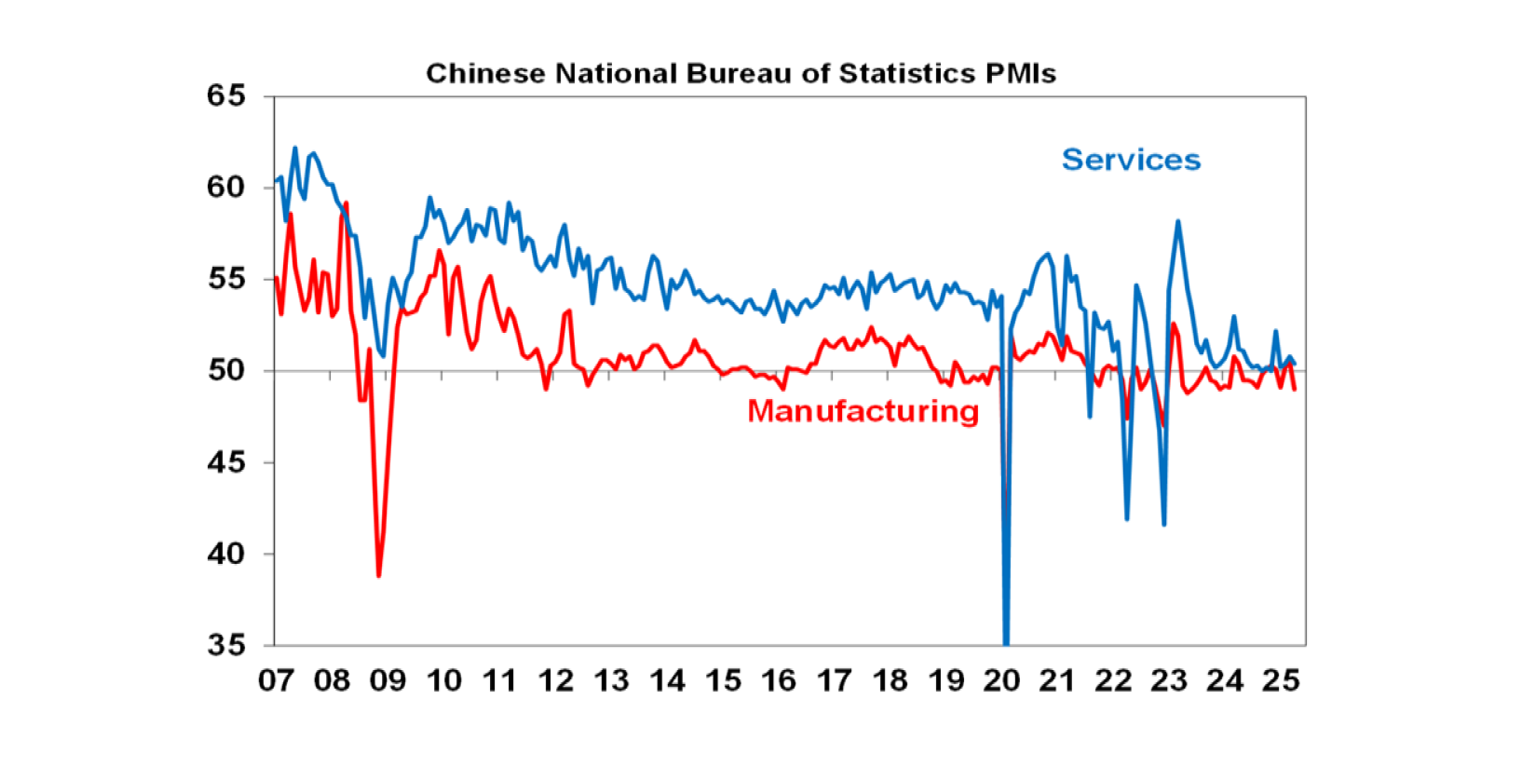
Chinese business conditions PMI’s weakened in April as the tariffs hit, particularly for manufacturing. This highlights the need for more policy stimulus with the April Politburo meeting pledging this.
Australian economic events and implications
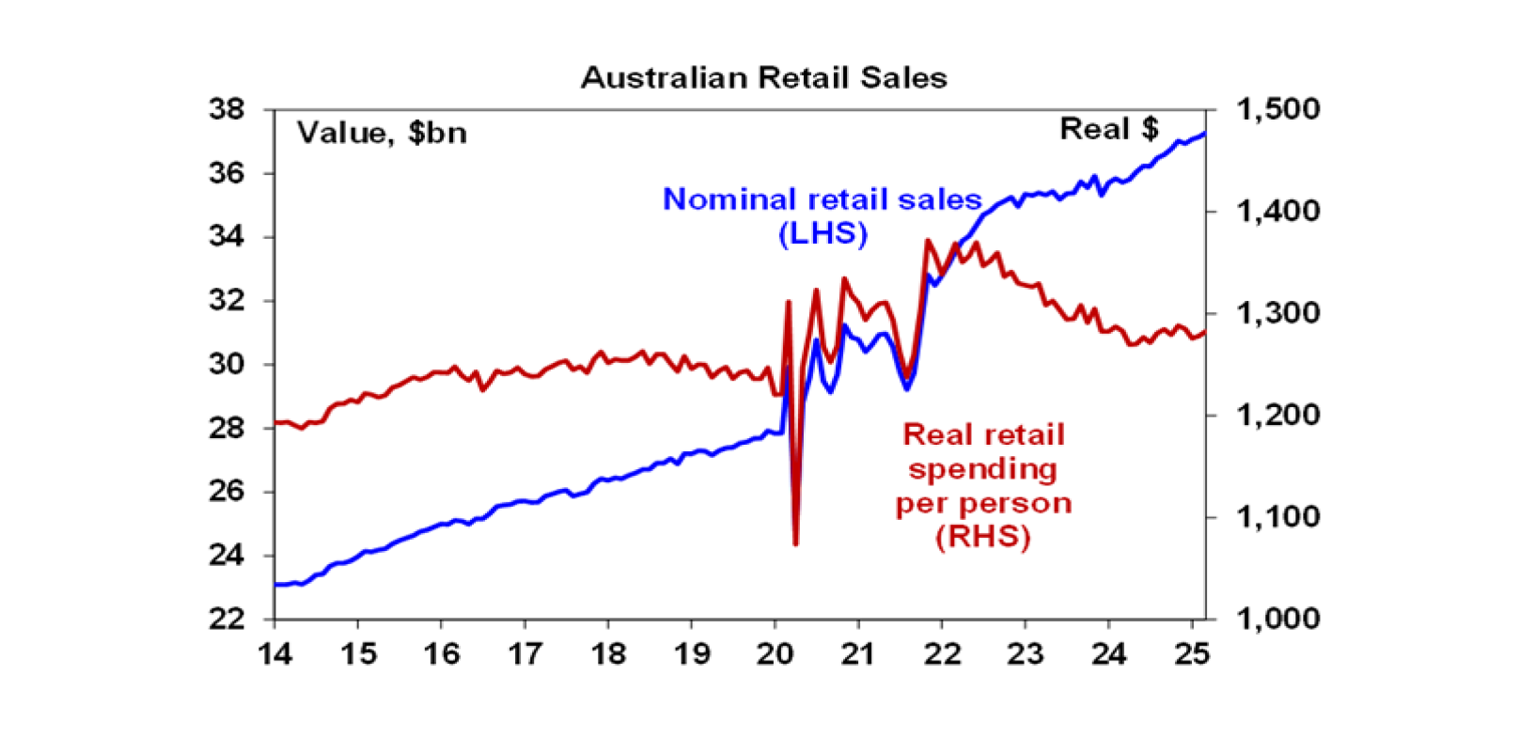
Australian data remains consistent with just a modest pick up in economic growth. March retail sales rose a softer than expected 0.3%mom mainly due to food spending ahead of Cyclone Alfred in Queensland, and retail volumes were flat in the March quarter and fell 0.4%%qoq per person. While price discounting boosted sales in the December quarter, households are clearly still struggling. After a roughly 6% fall in real retail sales per person over the two years to June last year, they are now basically trending sideways. A gradual uptrend is likely to resume on the back of rising real wages, low unemployment and improved confidence but its likely to require more rate cuts, particularly in face of the economic uncertainty flowing from Trump’s trade war.
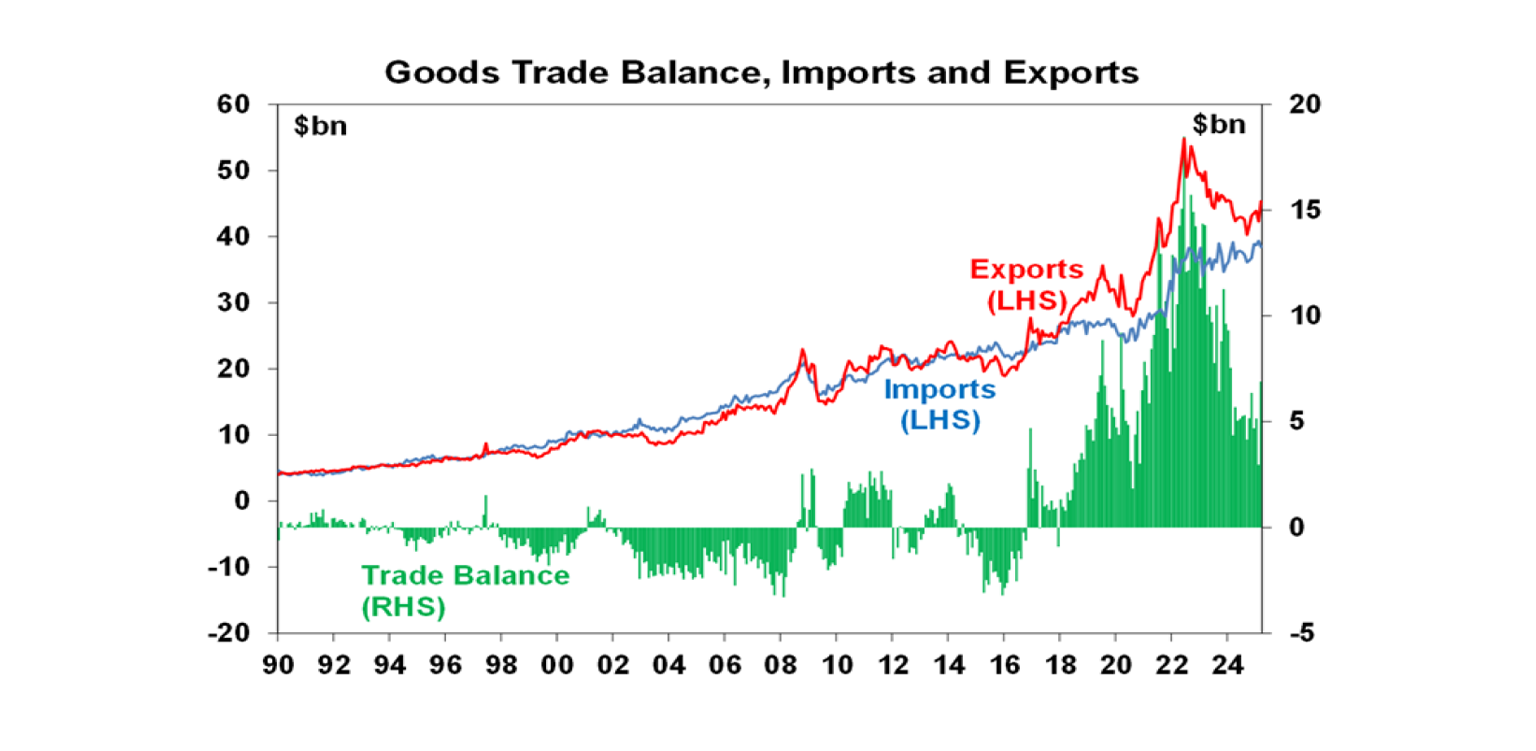
Australia’s trade surplus rebounded in March helped by a 7.6%mom rise in exports as iron ore exports rebounded and exports to the US, particularly gold, continued to surge ahead of the implementation of tariffs. The front running of US tariffs (which was reflected in the fall in US March quarter GDP) won’t be sustained and along with the trade surplus seen with the US in the March quarter will be reversed going forward. Net export volumes look like making a flat contribution to March quarter GDP growth.
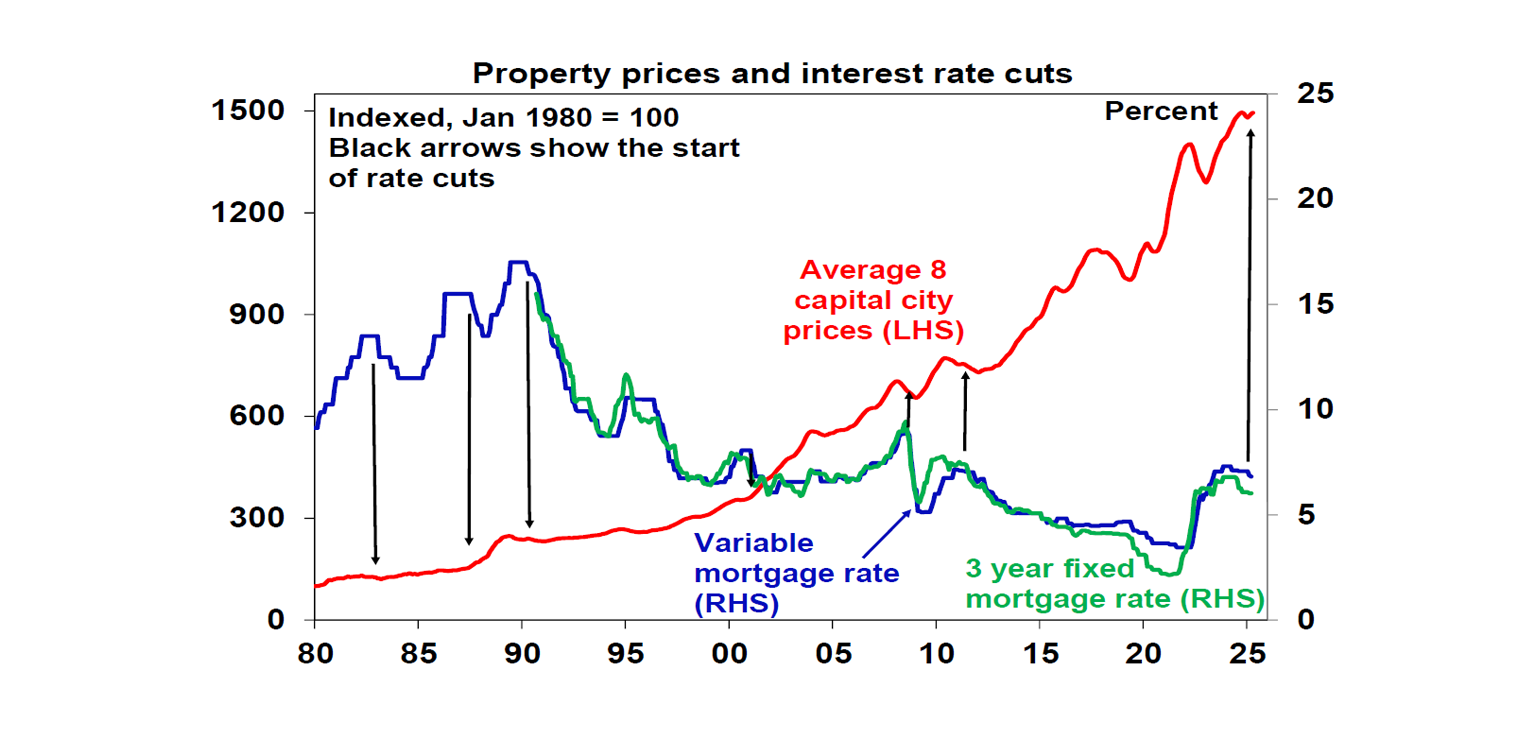
Home prices rose for the third month in April with an average rise of 0.3% and all capital cities seeing gains.
What to watch over the week ahead?
Apart from US tariff developments and reactions to the Australian election result…
In the US, the Fed (Wednesday) is likely to leave rates on hold again at 4.25-5%, as it remains in wait and see mode in relation to the impact of the tariffs in hitting economic growth and boosting inflation. The services conditions ISM (Monday) is likely to show a further fall to around 50 from 50.8.
On Thursday the Bank of England is expected to cut its key policy rate by 0.25% taking it to 4.25%, but the Swedish central bank is expected to remain on hold at 2.25%.
Chinese exports for April (Friday) are expected to slump after they were boosted by tariff front running in March. Import growth is likely to remain weak.
In Australia, expect March data to show a 3% gain in building approvals and flat household spending (both Tuesday).
Outlook for investment markets
Shares are at high risk of further falls given the ongoing tariff war, increased recession risk particularly in the US and the risk of a US/Israeli strike on Iran’s nuclear capability if diplomacy doesn’t work. Even if the low has been seen volatility is likely to remain high. But with Trump likely to ultimately back down further on the tariffs (after declaring victory of course!) and pivot towards more market friendly policies like tax cuts and deregulation, and central banks, including the RBA, likely to cut rates further shares are likely to recover on a more sustainable basis into year end. But it’s likely to be a rough ride.
Bonds are likely to provide returns around running yield or a bit more, as growth weakens, and central banks cut rates.
Unlisted commercial property returns are likely to improve in 2025 as office prices have already had sharp falls in response to the lagged impact of high bond yields and working from home.
Australian home prices have likely started an upswing on the back of lower interest rates. But it’s likely to be modest with US tariff worries constraining buyers and posing a near term threat of a reversal in prices and affordability remaining poor. We see home prices rising around 3% this year.
Cash and bank deposits are expected to provide returns of around 4%, but they are likely to slow as the cash rate falls.
The $A is likely to be buffeted between the negative impact of US tariffs and the global trade war and the potential positive of a further fall in the overvalued US dollar as its safe haven status comes under question. This could leave it weak around or just below $US0.60 in the near term. Undervaluation should support it on a medium-term view with fair value around $US0.73.
You may also like
-

Oliver's insights - Why have Australian living standards “fallen” and how do we fix it? For the last few years there has been much talk of a “cost-of-living” crisis in Australia and of “falling living standards”. This has flared up again lately with the pickup in inflation resulting in a renewed fall in real wages. -

Weekly market update - 10-07-2026 Ceasefire over but markets are also over the war, Why oil prices can't go too low or too high, Is AI adding to inflation risk or taking it away, and Australia’s wage problem. -

How to protect yourself from phishing and impersonation scams Phishing scams can look like everyday messages – emails, texts or calls. Learn the signs and simple steps to protect your money and personal information.
Important information
While every care has been taken in the preparation of this document, neither National Mutual Funds Management Ltd (ABN 32 006 787 720, AFSL 234652) (NMFM), AMP Limited ABN 49 079 354 519 nor any other member of the AMP Group (AMP) makes any representations or warranties as to the accuracy or completeness of any statement in it including, without limitation, any forecasts. Past performance is not a reliable indicator of future performance.
This document has been prepared for the purpose of providing general information, without taking account of any particular investor’s objectives, financial situation or needs. An investor should, before making any investment decisions, consider the appropriateness of the information in this document, and seek professional advice, having regard to the investor’s objectives, financial situation and needs. This document is solely for the use of the party to whom it is provided.
This document is not intended for distribution or use in any jurisdiction where it would be contrary to applicable laws, regulations or directives and does not constitute a recommendation, offer, solicitation or invitation to invest.